

B. Riley's analyst, Liam Burke, has increased the price target for Titan Machinery (TITN, Financial) from $19 to $22, maintaining a Neutral rating on the stock. The company's first-quarter revenue saw a year-over-year decline of 6.7%, yet outperformed expectations. This performance was largely attributed to the timing of pre-sold agricultural equipment sales, rather than improvements within the challenging agricultural sector.
Despite the difficult macroeconomic climate, Titan Machinery (TITN, Financial) effectively navigates the market by leveraging stronger contributions from high-margin parts and services. This approach helps mitigate the impact of reduced equipment sales, showing resilience in an otherwise tough environment.
Wall Street Analysts Forecast
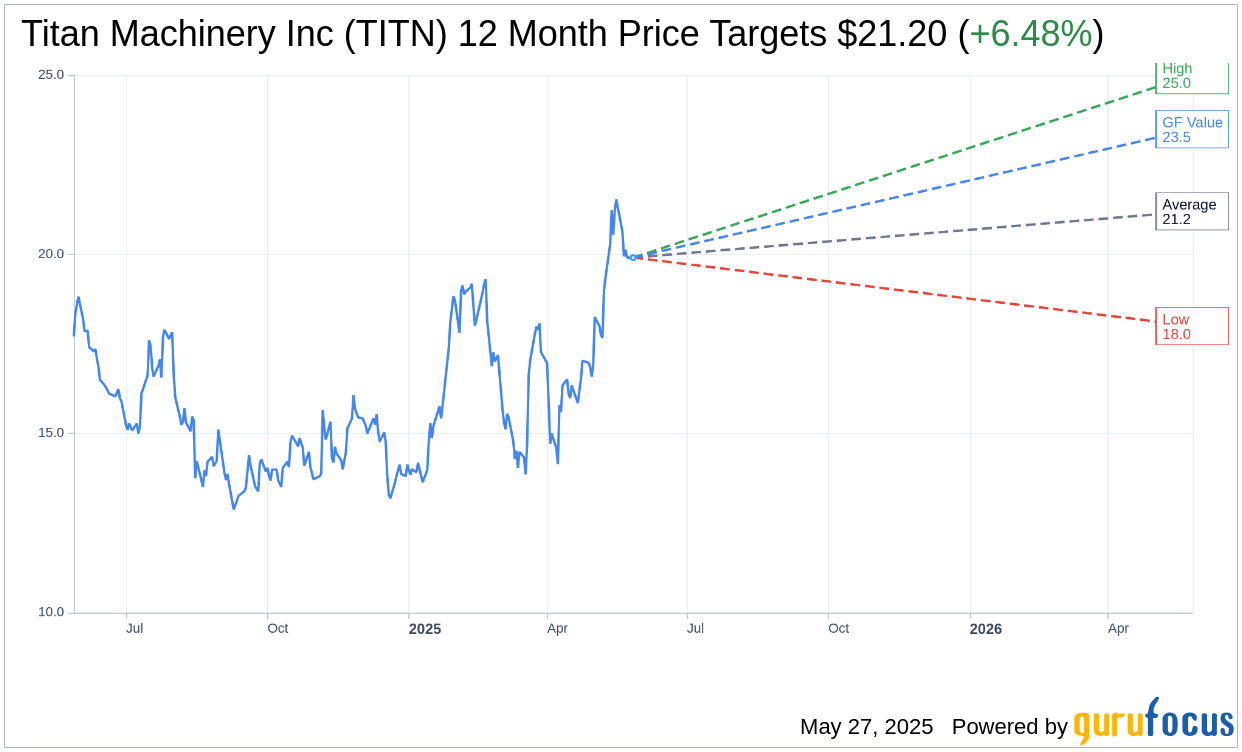
Based on the one-year price targets offered by 5 analysts, the average target price for Titan Machinery Inc (TITN, Financial) is $21.20 with a high estimate of $25.00 and a low estimate of $18.00. The average target implies an upside of 6.48% from the current price of $19.91. More detailed estimate data can be found on the Titan Machinery Inc (TITN) Forecast page.
Based on the consensus recommendation from 5 brokerage firms, Titan Machinery Inc's (TITN, Financial) average brokerage recommendation is currently 2.2, indicating "Outperform" status. The rating scale ranges from 1 to 5, where 1 signifies Strong Buy, and 5 denotes Sell.
Based on GuruFocus estimates, the estimated GF Value for Titan Machinery Inc (TITN, Financial) in one year is $23.49, suggesting a upside of 17.98% from the current price of $19.91. GF Value is GuruFocus' estimate of the fair value that the stock should be traded at. It is calculated based on the historical multiples the stock has traded at previously, as well as past business growth and the future estimates of the business' performance. More detailed data can be found on the Titan Machinery Inc (TITN) Summary page.
TITN Key Business Developments
Release Date: May 22, 2025
- Total Revenue: $594.3 million, a decrease from $628.7 million in the prior year period.
- Same Store Sales: Decreased by 5.5%.
- Gross Profit: $90.9 million, down from $121.8 million in the prior year.
- Gross Profit Margin: 15.3%.
- Operating Expenses: $96.4 million, a decrease from $99.2 million in the prior year.
- Net Loss: $13.2 million or $0.58 per diluted share, compared to net income of $9.4 million or $0.41 per diluted share in the prior year.
- Agriculture Segment Revenue: $384.4 million, with a same store sales decrease of 14.1%.
- Construction Segment Revenue: $72.1 million, with a same store sales increase of 0.9%.
- European Segment Revenue: $93.9 million, a 44.2% increase, with a same store sales increase of 44%.
- Australia Segment Revenue: $44 million, with a same store sales decrease of 1%.
- Inventory: Total inventories at $1.1 billion, with equipment inventory reduced by approximately $13 million sequentially to $913 million.
- Floorplan and Other Interest Expense: $11.1 million, decreased 15.3% sequentially.
- Adjusted Debt to Tangible Net Worth Ratio: 1.8, below the bank covenant of 3.5 times.
For the complete transcript of the earnings call, please refer to the full earnings call transcript.
Positive Points
- Titan Machinery Inc (TITN, Financial) demonstrated strong inventory management, maintaining total inventories at $1.1 billion, consistent with expectations.
- The company's customer care initiative, focusing on parts and service, provides a stable revenue foundation, contributing significantly to gross profit.
- The European segment, particularly in Romania, showed robust growth due to EU stimulus funds, with sales increasing by 44.2%.
- Titan Machinery Inc (TITN) received recognition from CNH with two top dealer awards for superior customer service.
- The construction segment showed modest growth and stability, supported by infrastructure projects despite broader economic uncertainties.
Negative Points
- The agricultural segment faced significant challenges, with a same store sales decrease of 14.1% and a pretax loss of $12.8 million.
- Overall revenue decreased by 5.5% compared to the prior year, reflecting a challenging market environment.
- Net loss for the first quarter was $13.2 million, a significant decline from the previous year's net income of $9.4 million.
- The Australian segment faced softer retail demand than anticipated, leading to a downward revision of full-year revenue expectations.
- Interest expenses increased year-over-year, with floorplan and other interest expenses rising to $11.1 million from $9.5 million.