

Goldman Sachs has adjusted its price target for Chart Industries (GTLS, Financial), increasing it from $173 to $180. This decision, led by analyst Ati Modak, follows the company's better-than-expected first-quarter earnings performance. Despite maintaining a Neutral rating for the stock, Goldman Sachs acknowledges potential upside for GTLS in the coming years. This optimism stems from the company's recent order activity and involvement in specific projects, which could influence projections for 2026 and 2027. However, the firm remains cautious about new LNG order estimates due to uncertainties regarding the timing and volume of future orders.
Wall Street Analysts Forecast
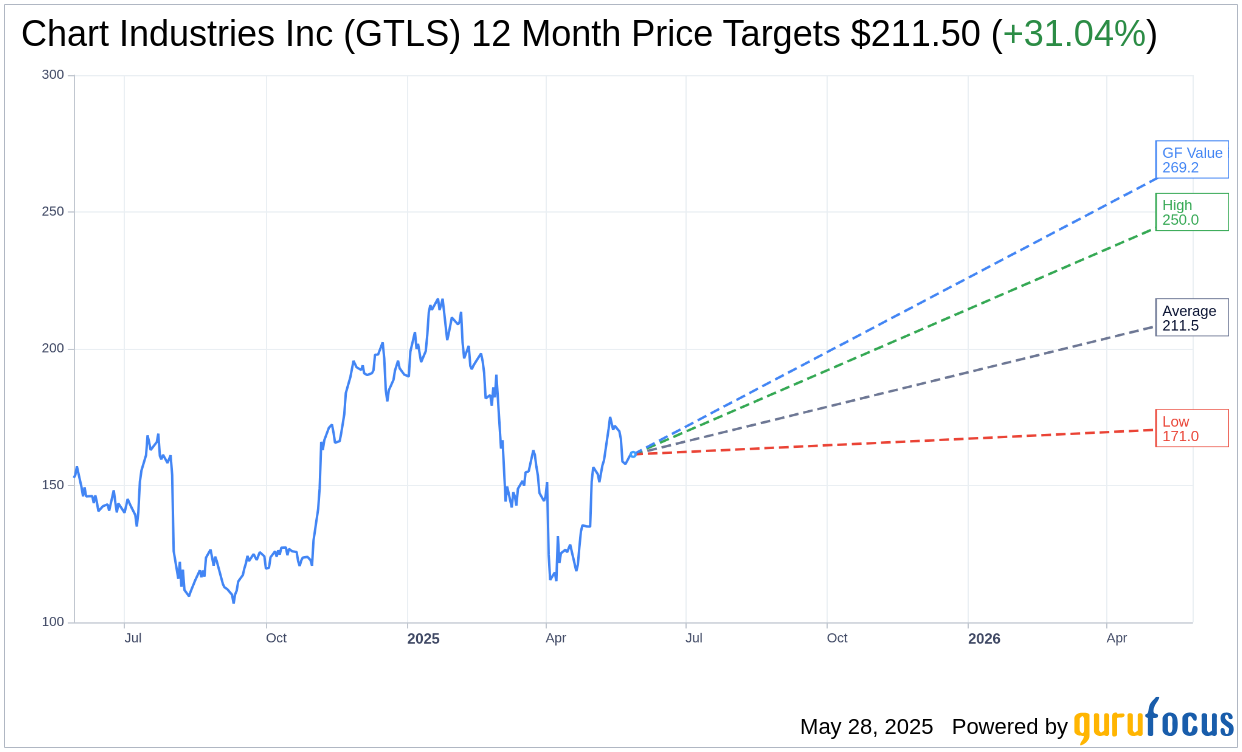
Based on the one-year price targets offered by 20 analysts, the average target price for Chart Industries Inc (GTLS, Financial) is $211.50 with a high estimate of $250.00 and a low estimate of $171.00. The average target implies an upside of 31.04% from the current price of $161.40. More detailed estimate data can be found on the Chart Industries Inc (GTLS) Forecast page.
Based on the consensus recommendation from 21 brokerage firms, Chart Industries Inc's (GTLS, Financial) average brokerage recommendation is currently 2.0, indicating "Outperform" status. The rating scale ranges from 1 to 5, where 1 signifies Strong Buy, and 5 denotes Sell.
Based on GuruFocus estimates, the estimated GF Value for Chart Industries Inc (GTLS, Financial) in one year is $269.19, suggesting a upside of 66.78% from the current price of $161.4. GF Value is GuruFocus' estimate of the fair value that the stock should be traded at. It is calculated based on the historical multiples the stock has traded at previously, as well as past business growth and the future estimates of the business' performance. More detailed data can be found on the Chart Industries Inc (GTLS) Summary page.
GTLS Key Business Developments
Release Date: May 01, 2025
- Orders: $1.32 billion, a 17.3% increase from Q1 2024.
- Sales: $1 billion, organically grew 6.6%.
- Gross Margin: 33.9%, marking the fourth consecutive quarter above 33%.
- Adjusted Operating Income Margin: Expanded by 190 basis points.
- Adjusted EBITDA: $231.1 million, 23.1% of sales, an increase of 80 basis points.
- Adjusted Diluted EPS: $1.86, a 38.8% increase.
- Free Cash Flow: Negative $80.1 million, improved by $55.6 million compared to Q1 2024.
- Net Leverage Ratio: 2.91, with a target of 2 to 2.5 by the end of 2025.
- CTS Orders: $152.6 million, decreased 4.2% from Q1 2024.
- HTS Orders: $220.7 million, declined 7% from Q1 2024.
- Specialty Products Orders: $487.7 million, increased 24.6% from Q1 2024.
- RSL Orders: $454.6 million, grew 36.1% from Q1 2024.
- Capital Expenditures: Anticipated to be 2% to 2.5% of sales for 2025.
- 2025 Sales Guidance: $4.65 billion to $4.85 billion.
- 2025 Adjusted EBITDA Guidance: $1.175 billion to $1.225 billion.
For the complete transcript of the earnings call, please refer to the full earnings call transcript.
Positive Points
- Chart Industries Inc (GTLS, Financial) reported a 17.3% increase in orders compared to the first quarter of 2024, driven by significant projects like Woodside Louisiana LNG Phase 2.
- The company achieved a gross margin of 33.9%, marking the fourth consecutive quarter above 33%, indicating strong operational efficiency.
- Adjusted EBITDA increased by 80 basis points to 23.1% of sales, reflecting improved profitability.
- The company has a robust commercial pipeline of approximately $24 billion, with significant potential LNG projects expected to enter the backlog in 2025.
- Chart Industries Inc (GTLS) maintained its full-year guidance for 2025, demonstrating confidence in its business outlook despite global uncertainties.
Negative Points
- Free cash flow was negative $80.1 million in the first quarter, although it showed improvement compared to the previous year.
- The company's net leverage ratio was 2.91, with a target to reduce it to 2 to 2.5 by the end of 2025, indicating ongoing financial leverage concerns.
- There is uncertainty in the industrial gas and hydrogen markets, particularly in the Americas, which could impact future demand.
- The company faces potential gross impacts from tariffs, estimated at approximately $50 million annually, which could affect profitability if not mitigated.
- Orders in the Cryo Tank Solutions segment decreased by 4.2% compared to the first quarter of 2024, indicating potential challenges in this area.