
By the end of March 31, Futu Holdings Limited (FUTU, Financial) announced an increase in its user base and client assets. The financial services firm reported having 26.25 million registered users, 4.96 million brokerage accounts, and 2.67 million funded accounts. Notably, the company's client assets saw a remarkable growth of 12% from the previous quarter and an impressive 60% year-over-year, reaching a total of $107 billion.
Wall Street Analysts Forecast
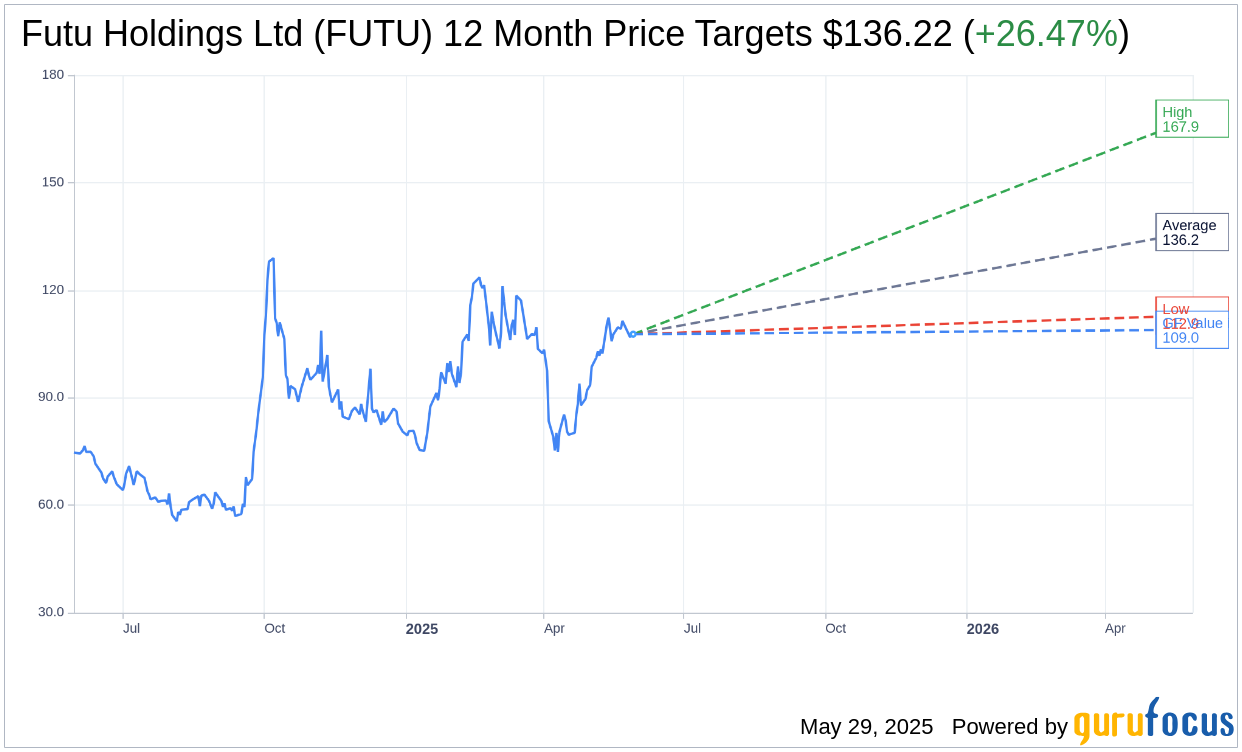
Based on the one-year price targets offered by 15 analysts, the average target price for Futu Holdings Ltd (FUTU, Financial) is $136.22 with a high estimate of $167.87 and a low estimate of $112.91. The average target implies an upside of 26.47% from the current price of $107.71. More detailed estimate data can be found on the Futu Holdings Ltd (FUTU) Forecast page.
Based on the consensus recommendation from 17 brokerage firms, Futu Holdings Ltd's (FUTU, Financial) average brokerage recommendation is currently 1.8, indicating "Outperform" status. The rating scale ranges from 1 to 5, where 1 signifies Strong Buy, and 5 denotes Sell.
Based on GuruFocus estimates, the estimated GF Value for Futu Holdings Ltd (FUTU, Financial) in one year is $108.95, suggesting a upside of 1.15% from the current price of $107.71. GF Value is GuruFocus' estimate of the fair value that the stock should be traded at. It is calculated based on the historical multiples the stock has traded at previously, as well as past business growth and the future estimates of the business' performance. More detailed data can be found on the Futu Holdings Ltd (FUTU) Summary page.
FUTU Key Business Developments
Release Date: March 13, 2025
- Total Revenue: HKD4.4 billion, up 87% year over year.
- Full Year Revenue: HKD13.6 billion, up 36% year over year.
- Brokerage Commission and Handling Charge Income: HKD2.1 billion, up 128% year over year.
- Interest Income: HKD2 billion, up 52% year over year.
- Other Income: HKD353 million, up 157% year over year.
- Total Cost: HKD776 million, up 79% year over year.
- Gross Profit: HKD3.7 billion, up 89% year over year.
- Gross Margin: 82.5%, compared to 81.7% in the previous year.
- Operating Expenses: HKD1.4 billion, up 57% year over year.
- Income from Operations: HKD2.2 billion, up 117% year over year.
- Operating Margin: 50%, up from 43.1% in the previous year.
- Net Income: HKD1.9 billion, up 113% year over year.
- Net Income Margin: 42.2%, compared to 36.9% in the previous year.
- Effective Tax Rate: 16.1%.
- Total Client Assets: HKD743 billion, up 43% year over year.
- Total Trading Volume: HKD2.89 trillion, up 202% year over year.
For the complete transcript of the earnings call, please refer to the full earnings call transcript.
Positive Points
- Futu Holdings Ltd (FUTU, Financial) exceeded its full-year guidance by adding 215,000 paying clients in Q4 2024, resulting in a total of over 2.4 million paying clients, a 41% increase year over year.
- The company recorded a significant increase in total client assets, reaching HKD743 billion, up 43% year over year and 7% quarter over quarter.
- Total trading volume surged by 202% year over year and 52% quarter over quarter to HKD2.89 trillion, with US stock trading volume reaching a historic high.
- Futu Holdings Ltd (FUTU) launched numerous product innovations, including US margin trading in Japan and an option strategy builder in the US, enhancing its trading platform capabilities.
- The company maintained strong growth in overseas markets, with significant net asset inflows and robust client engagement, particularly in Hong Kong, Singapore, and Japan.
Negative Points
- The pullback of China equity in the second half of the quarter negatively impacted the valuation of clients' assets.
- Client acquisition costs increased moderately in Q4 2024, despite an active market environment, due to changes in market mix and channels.
- Operating expenses rose significantly, with general and administrative expenses increasing by 55% year over year and 51% quarter over quarter.
- The blended trading commission rate declined both year-over-year and sequentially in Q4, partly due to changes in product mix.
- Despite strong trading volumes, the brokerage income growth rate was slower than trading volume growth due to the pricing model for US options and stock trading.