
Long-established in the Consumer Packaged Goods industry, Lamb Weston Holdings Inc (LW, Financial) has enjoyed a stellar reputation. It has recently witnessed a daily gain of 0.22%, juxtaposed with a three-month change of 3.84%. However, fresh insights from the GF Score hint at potential headwinds. Notably, its diminished rankings in financial strength, growth, and valuation suggest that the company might not live up to its historical performance. Join us as we dive deep into these pivotal metrics to unravel the evolving narrative of Lamb Weston Holdings Inc.
What Is the GF Score?
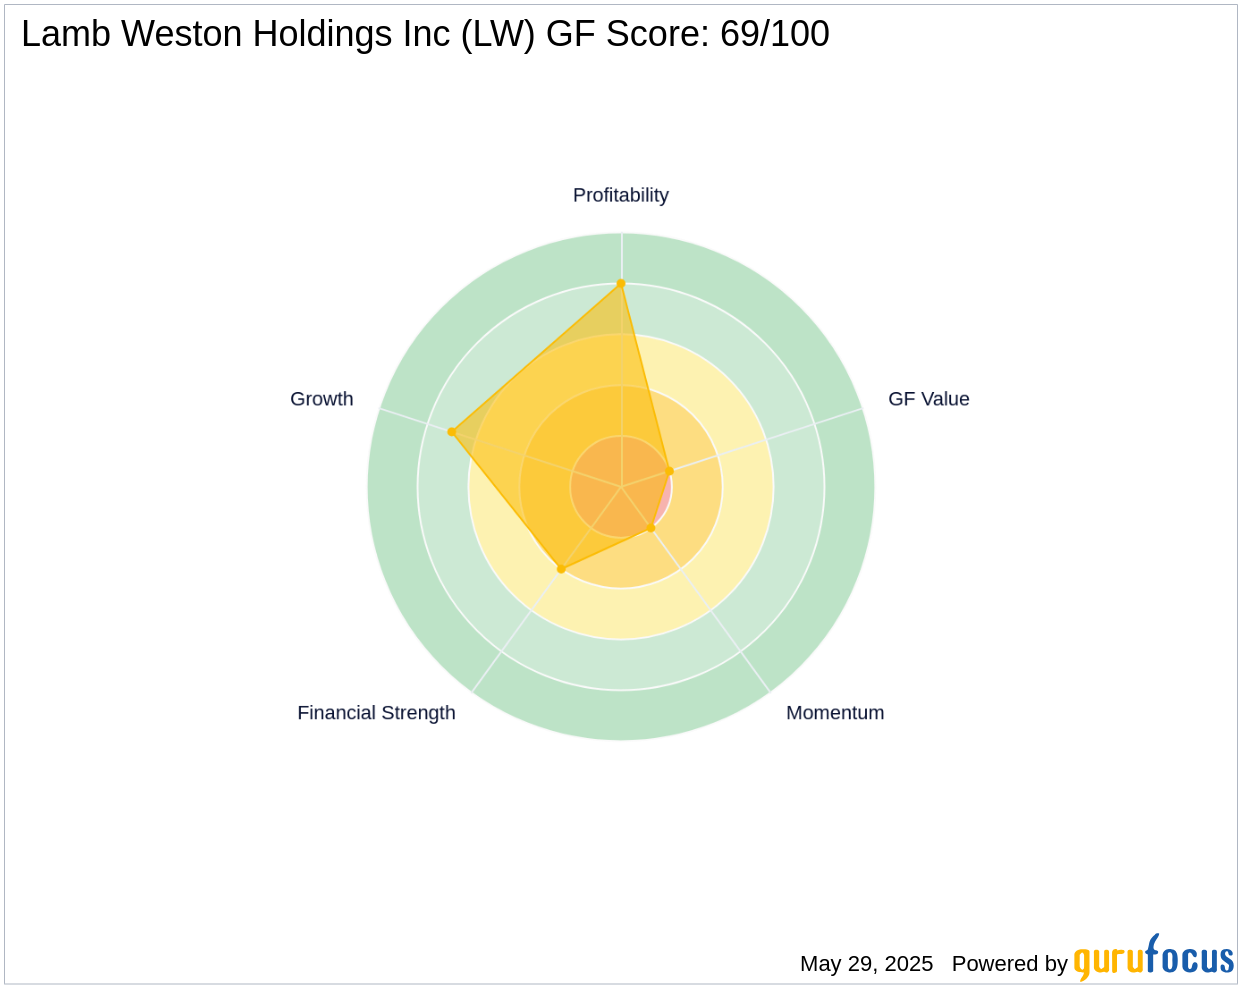
The GF Score is a stock performance ranking system developed by GuruFocus using five aspects of valuation, which has been found to be closely correlated to the long-term performances of stocks by backtesting from 2006 to 2021. The stocks with a higher GF Score generally generate higher returns than those with a lower GF Score. Therefore, when picking stocks, investors should invest in companies with high GF Scores. The GF Score ranges from 0 to 100, with 100 as the highest rank.
- Financial strength rank: 4/10
- Profitability rank: 8/10
- Growth rank: 7/10
- GF Value rank: 2/10
- Momentum rank: 2/10
Based on the above method, GuruFocus assigned Lamb Weston Holdings Inc the GF Score of 69 out of 100, which signals poor future outperformance potential.
Understanding Lamb Weston Holdings Inc Business
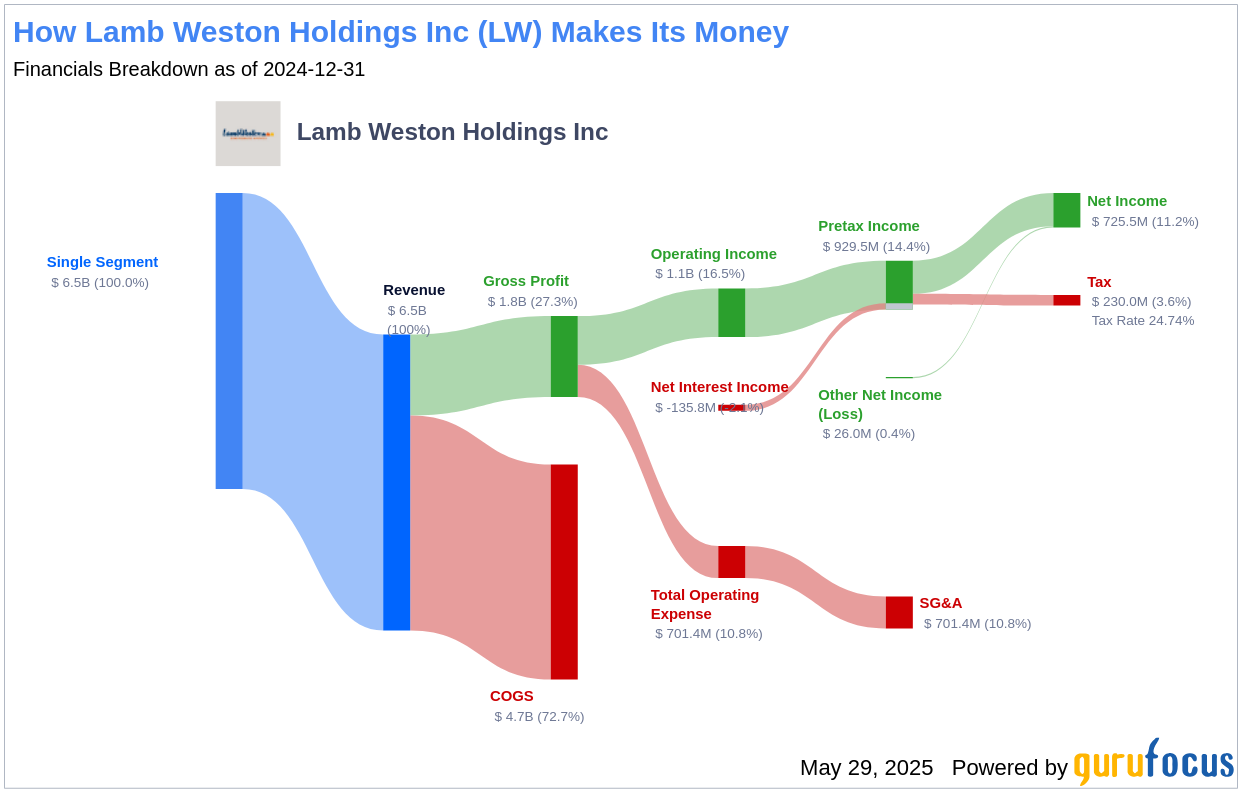
Lamb Weston Holdings Inc is North America's largest and the world's second-largest producer of branded and private-label frozen potato products, both by volume and value. The company's portfolio is anchored by french fries, but it also sells sweet potato fries, tater tots, diced potatoes, mashed potatoes, hash browns, and chips. Roughly two-thirds of revenue comes from its home market of North America, with none of the other 100 countries the company sells into representing a significant share. McDonald's is Lamb Weston's single-largest customer at 14% of fiscal 2024 sales, with no other company representing more than 10%. Lamb Weston became an independent company in 2016 when it was spun off from Conagra.
Financial Strength Breakdown
Lamb Weston Holdings Inc's financial strength indicators present some concerning insights about the company's balance sheet health. Lamb Weston Holdings Inc has an interest coverage ratio of 4.41, which positions it worse than 66.33% of 1,470 companies in the Consumer Packaged Goods industry. This ratio highlights potential challenges the company might face when handling its interest expenses on outstanding debt. It's worth noting that the esteemed investor Benjamin Graham typically favored companies with an interest coverage ratio of at least five.
The company's Altman Z-Score is just 2.57, which is below the safe threshold of 2.99. Although this does not imply immediate danger of financial distress, the stock may face some financial struggles if the Altman Z-score drops below 1.81.
Additionally, the company's low cash-to-debt ratio at 0.02 indicates a struggle in handling existing debt levels. The company's debt-to-equity ratio is 2.61, which is worse than 95.4% of 1,653 companies in the Consumer Packaged Goods industry. A high debt-to-equity ratio suggests over-reliance on borrowing and vulnerability to market fluctuations.
Conclusion
In conclusion, while Lamb Weston Holdings Inc has a strong market presence and a diverse product portfolio, its financial strength, profitability, and growth metrics, as highlighted by the GF Score, indicate potential underperformance. The company's high debt levels and low interest coverage ratio are significant concerns that could hinder its ability to capitalize on growth opportunities. Investors should carefully consider these factors when evaluating the company's future prospects. For those interested in exploring companies with stronger GF Scores, GuruFocus Premium members can use the following screener link: GF Score Screen.
This article, generated by GuruFocus, is designed to provide general insights and is not tailored financial advice. Our commentary is rooted in historical data and analyst projections, utilizing an impartial methodology, and is not intended to serve as specific investment guidance. It does not formulate a recommendation to purchase or divest any stock and does not consider individual investment objectives or financial circumstances. Our objective is to deliver long-term, fundamental data-driven analysis. Be aware that our analysis might not incorporate the most recent, price-sensitive company announcements or qualitative information. GuruFocus holds no position in the stocks mentioned herein.