

Notable activity has been observed in the options market for EchoStar (SATS, Financial), with a total of 3,240 call options traded, which is 1.5 times the usual volume. The implied volatility has risen by over one point, reaching 68.22%. The July 25th $25 calls and October 25th $24 calls are particularly popular, accounting for nearly 3,000 contracts. The Put/Call Ratio stands at a low 0.05, indicating a bullish sentiment in the market. EchoStar (SATS) is scheduled to announce its earnings on August 7th.
Wall Street Analysts Forecast
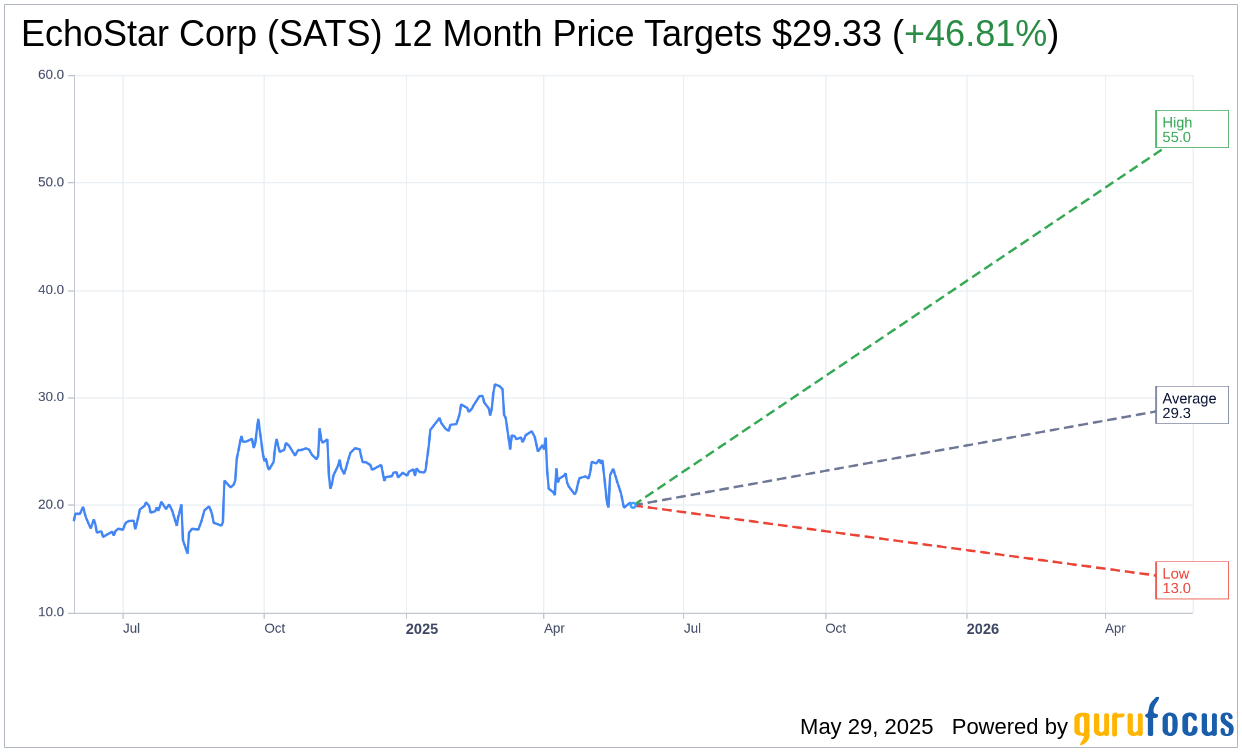
Based on the one-year price targets offered by 6 analysts, the average target price for EchoStar Corp (SATS, Financial) is $29.33 with a high estimate of $55.00 and a low estimate of $13.00. The average target implies an upside of 46.81% from the current price of $19.98. More detailed estimate data can be found on the EchoStar Corp (SATS) Forecast page.
Based on the consensus recommendation from 7 brokerage firms, EchoStar Corp's (SATS, Financial) average brokerage recommendation is currently 2.7, indicating "Hold" status. The rating scale ranges from 1 to 5, where 1 signifies Strong Buy, and 5 denotes Sell.
Based on GuruFocus estimates, the estimated GF Value for EchoStar Corp (SATS, Financial) in one year is $4.61, suggesting a downside of 76.93% from the current price of $19.98. GF Value is GuruFocus' estimate of the fair value that the stock should be traded at. It is calculated based on the historical multiples the stock has traded at previously, as well as past business growth and the future estimates of the business' performance. More detailed data can be found on the EchoStar Corp (SATS) Summary page.
SATS Key Business Developments
Release Date: May 09, 2025
- Revenue: Approximately $3.9 billion in Q1, down 3.6% year over year.
- OIBDA: $400 million in Q1, a decrease of $17 million or approximately 15% year over year.
- Operating Free Cash Flow: Positive $77 million in Q1.
- Free Cash Flow (including debt service): Negative $172 million, an improvement of $55 million compared to the prior year.
- Total Cash and Marketable Securities: $5.4 billion at the end of Q1, a decrease of $464 million compared to year-end.
- Wireless Revenue: Increased by 6.4% to $973 million in Q1.
- Pay-TV Revenue: Decreased by 6.9% to $2.5 billion in Q1.
- BSS Revenue: Decreased by 3.1% to $371 million in Q1.
- Wireless Subscribers: Increased to approximately 7.15 million.
- Pay-TV Subscribers: DISH TV finished the quarter with approximately 5.5 million subscribers.
- Churn Rate: DISH TV churn reduced to 1.36% from 1.53% year over year.
- Pay-TV ARPU Growth: Year-over-year increase of over $3 or 3%.
- Capital Expenditures: $378 million in Q1, including capitalized interest.
- 5G Network Sites: Over 24,000 5G sites on air, meeting FCC requirements ahead of schedule.
For the complete transcript of the earnings call, please refer to the full earnings call transcript.
Positive Points
- EchoStar Corp (SATS, Financial) reported strong wireless performance with 150,000 net subscriber additions in Q1 2025, a significant improvement from an 81,000 net loss in the same period of 2024.
- The company expanded its prepaid and postpaid offerings, contributing to subscriber growth and improved churn rates by 7.2% year over year.
- EchoStar Corp (SATS) increased its wireless subscribers to approximately 7.15 million, with an increase in ARPU, indicating improved subscriber quality.
- The Hughes business made progress in the enterprise domain, with universal compatibility of in-flight connectivity terminals and expanded contracts with major airlines like Delta.
- EchoStar Corp (SATS) achieved a positive operating free cash flow of $77 million in Q1 2025, demonstrating disciplined cost management and growth in wireless and Hughes enterprise businesses.
Negative Points
- Revenue decreased by 3.6% year over year to approximately $3.9 billion, primarily due to fewer subscribers in the Pay-TV segment.
- OIBDA decreased by $17 million year over year, driven by increased marketing expenses in the wireless segment and decreased OIBDA from the Pay-TV segment.
- Free cash flow, including debt service, was negative $172 million in Q1 2025, despite an improvement compared to the prior year.
- The Pay-TV segment experienced a 6.9% revenue decline due to a lower average subscriber base, despite an increase in ARPU.
- Broadband and satellite services revenue decreased by 3.1%, attributed to lower sales of broadband services to consumers and enterprise customers.