

Key Takeaways:
- Interactive Brokers (IBKR, Financial) reports a significant 43% increase in daily average revenue trades year-over-year for May.
- Despite monthly fluctuations, client equity reaches an impressive $628.2 billion.
- Wall Street analysts maintain an average price target, estimating a slight downside from current values.
Interactive Brokers' Impressive Trade Growth
Interactive Brokers (IBKR) continues to demonstrate robust performance with a notable 43% year-over-year increase in daily average revenue trades for May, totaling 3.384 million. However, this figure represents an 11% decline from the previous month, indicating some volatility in trading activity.
Client Equity and Financial Growth
Client equity at Interactive Brokers closed the month at $628.2 billion, showcasing a 29% rise annually, alongside a 7% uptick from the preceding month. Margin loan balances and credit balances further bolstered their financial growth, posting significant increases on a yearly basis.
Analyst Forecasts and Recommendations
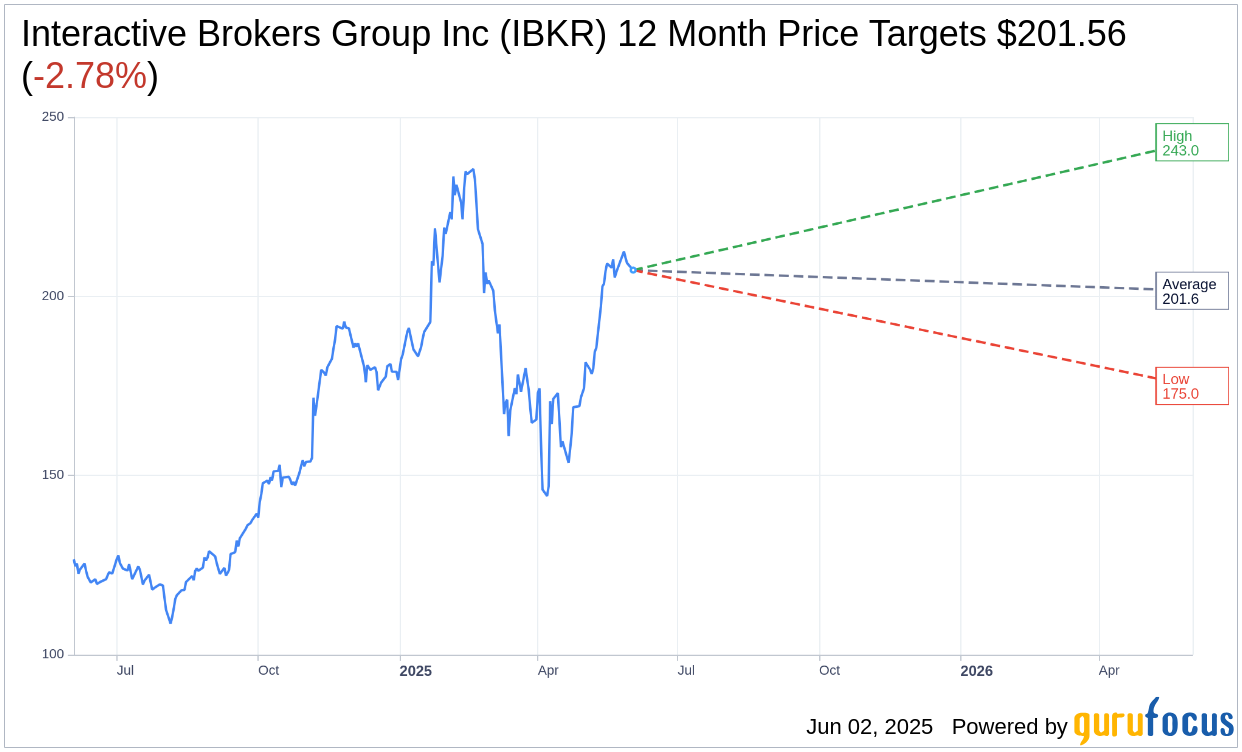
According to projections by nine analysts, the one-year average price target for Interactive Brokers Group Inc (IBKR, Financial) stands at $201.56. The high estimate reaches $243.00, while the low is at $175.00, suggesting a potential downside of 2.78% from the current trading price of $207.31. Further detailed estimates can be explored on the Interactive Brokers Group Inc (IBKR) Forecast page.
The consensus from 10 brokerage firms pegs Interactive Brokers Group Inc's average recommendation at 1.7, which categorizes the stock as "Outperform." The rating scale ranges from 1, representing a Strong Buy, to 5, signifying Sell.
GF Value and Market Valuation
GuruFocus estimates suggest the GF Value for Interactive Brokers Group Inc (IBKR, Financial) in one year is $98.15. This implies a significant downside of 52.66% from its present price of $207.31. The GF Value represents GuruFocus' assessment of the stock's fair market value, derived from historical trading multiples, historical business growth, and future performance predictions. For a comprehensive view, visit the Interactive Brokers Group Inc (IBKR) Summary page.