

Citi has increased its price target for Microsoft (MSFT, Financial) from $540 to $605, while maintaining a Buy rating on the stock. The investment firm has also placed an "upside 90-day catalyst watch" on the shares. Citi cites Microsoft's durability in a volatile economic setting, its ongoing artificial intelligence product developments, and a strengthened belief that current market predictions for Azure's performance in fiscal 2026 may be underestimated.
Citi anticipates the stock's catalyst could be revealed with the fiscal fourth-quarter earnings and subsequent announcements of fiscal 2026 guidance, as revenues from both Microsoft and OpenAI continue to grow. The firm notes that Azure has reached a turning point, supported by its recent exit rate calculations and token usage data.
Wall Street Analysts Forecast
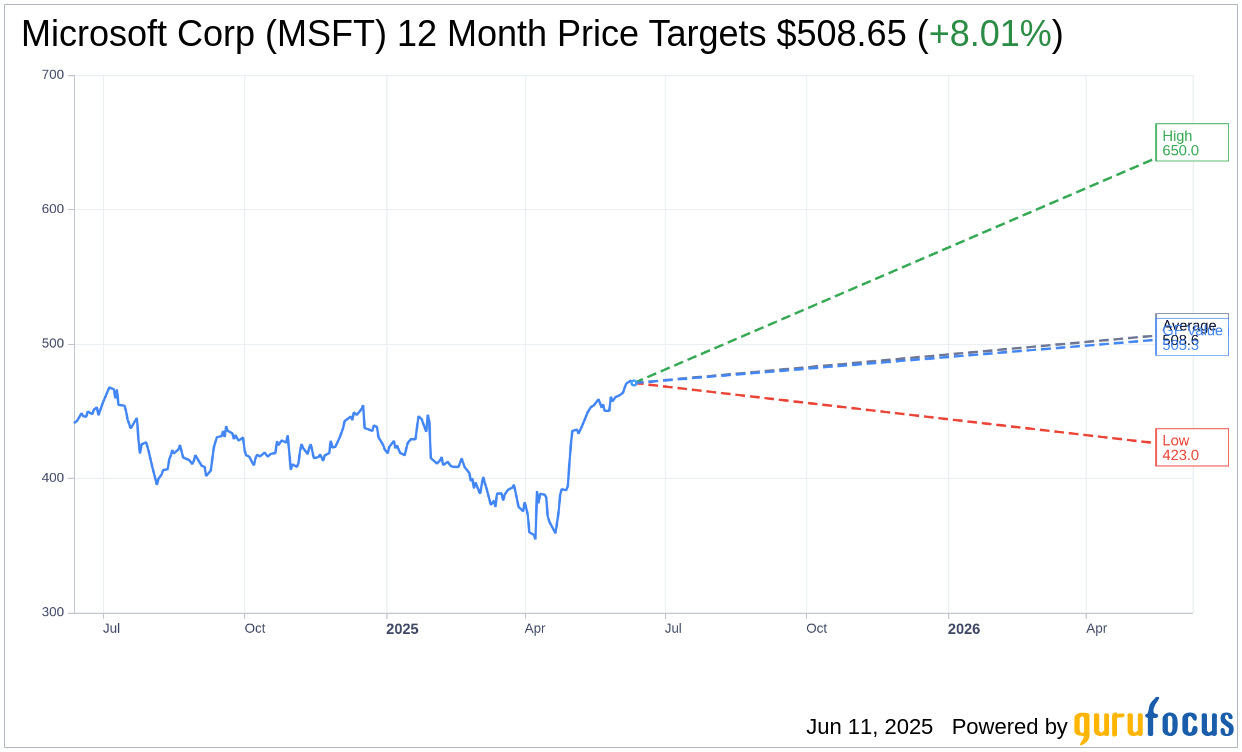
Based on the one-year price targets offered by 49 analysts, the average target price for Microsoft Corp (MSFT, Financial) is $508.65 with a high estimate of $650.00 and a low estimate of $423.00. The average target implies an upside of 8.01% from the current price of $470.92. More detailed estimate data can be found on the Microsoft Corp (MSFT) Forecast page.
Based on the consensus recommendation from 62 brokerage firms, Microsoft Corp's (MSFT, Financial) average brokerage recommendation is currently 1.8, indicating "Outperform" status. The rating scale ranges from 1 to 5, where 1 signifies Strong Buy, and 5 denotes Sell.
Based on GuruFocus estimates, the estimated GF Value for Microsoft Corp (MSFT, Financial) in one year is $505.29, suggesting a upside of 7.3% from the current price of $470.92. GF Value is GuruFocus' estimate of the fair value that the stock should be traded at. It is calculated based on the historical multiples the stock has traded at previously, as well as past business growth and the future estimates of the business' performance. More detailed data can be found on the Microsoft Corp (MSFT) Summary page.
MSFT Key Business Developments
Release Date: April 30, 2025
- Revenue: $70.1 billion, up 13% (15% in constant currency).
- Gross Margin: Increased 11% (13% in constant currency); percentage was 69%, down 1 point year-over-year.
- Operating Income: Increased 16% (19% in constant currency).
- Earnings Per Share (EPS): $3.46, an increase of 18% (19% in constant currency).
- Microsoft Cloud Revenue: $42.4 billion, grew 20% (22% in constant currency).
- Commercial Bookings: Increased 18% (17% in constant currency).
- Commercial Remaining Performance Obligation: $315 billion, up 34% (33% in constant currency).
- Productivity and Business Processes Revenue: $29.9 billion, grew 10% (13% in constant currency).
- Intelligent Cloud Revenue: $26.8 billion, grew 21% (22% in constant currency).
- Azure and Other Cloud Services Revenue: Grew 33% (35% in constant currency).
- More Personal Computing Revenue: $13.4 billion, grew 6% (7% in constant currency).
- Capital Expenditures: $21.4 billion.
- Cash Flow from Operations: $37 billion, up 16%.
- Free Cash Flow: $20.3 billion.
- Return to Shareholders: $9.7 billion through dividends and share repurchases, up 15% year-over-year.
For the complete transcript of the earnings call, please refer to the full earnings call transcript.
Positive Points
- Microsoft Cloud revenue surpassed $42 billion, up 22% in constant currency, showcasing strong demand for cloud and AI offerings.
- Azure and other cloud services revenue grew 33% and 35% in constant currency, driven by strong demand for AI services.
- Microsoft 365 Copilot usage tripled year-over-year, indicating strong adoption of AI-driven productivity tools.
- LinkedIn revenue increased 7% and 8% in constant currency, with significant growth in LinkedIn Premium subscriptions.
- Gaming revenue increased 5% and 6% in constant currency, with Xbox content and services revenue growing 8% and 9% in constant currency.
Negative Points
- On-premises server business revenue decreased 6% and 4% in constant currency, reflecting a continued shift to cloud offerings.
- Microsoft Cloud gross margin percentage decreased by 3 points year-over-year due to the impact of scaling AI infrastructure.
- Operating expenses increased 6% and 7% in constant currency, driven by investments in AI infrastructure.
- There are AI capacity constraints expected beyond June, indicating potential challenges in meeting growing demand.
- The Talent Solutions business within LinkedIn continues to be impacted by weakness in the hiring market.