
LyondellBasell Industries NV (LYB, Financial), a prominent player in the Chemicals industry, has long been recognized for its robust market presence. Recently, the company experienced a daily gain of 2.01%, contrasting with a three-month decline of -13.42%. However, insights from the GF Score suggest potential challenges ahead. The company's lower rankings in financial strength, growth, and valuation indicate that it may struggle to replicate its past successes. In this article, we delve into these critical metrics to understand the evolving narrative of LyondellBasell Industries NV.
Understanding the GF Score
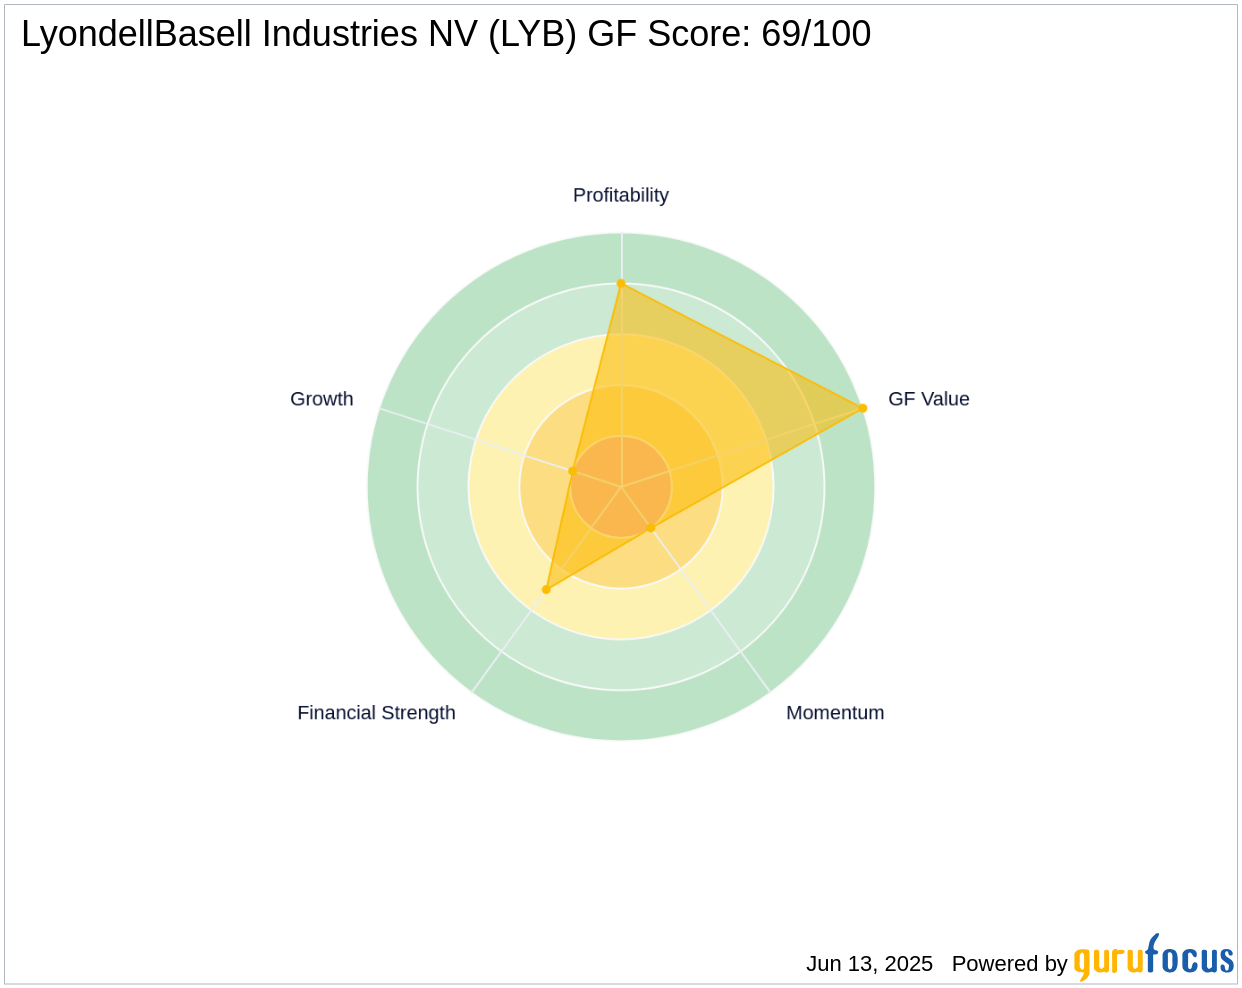
The GF Score is a stock performance ranking system developed by GuruFocus, evaluating five aspects of valuation. This system has shown a strong correlation with long-term stock performance, as evidenced by backtesting from 2006 to 2021. Stocks with higher GF Scores tend to yield better returns than those with lower scores. The GF Score ranges from 0 to 100, with 100 being the highest rank. For LyondellBasell Industries NV, the GF Score is 69 out of 100, indicating limited potential for future outperformance.
- Financial strength rank: 5/10
- Profitability rank: 8/10
- Growth rank: 2/10
- GF Value rank: 10/10
- Momentum rank: 2/10
Company Overview
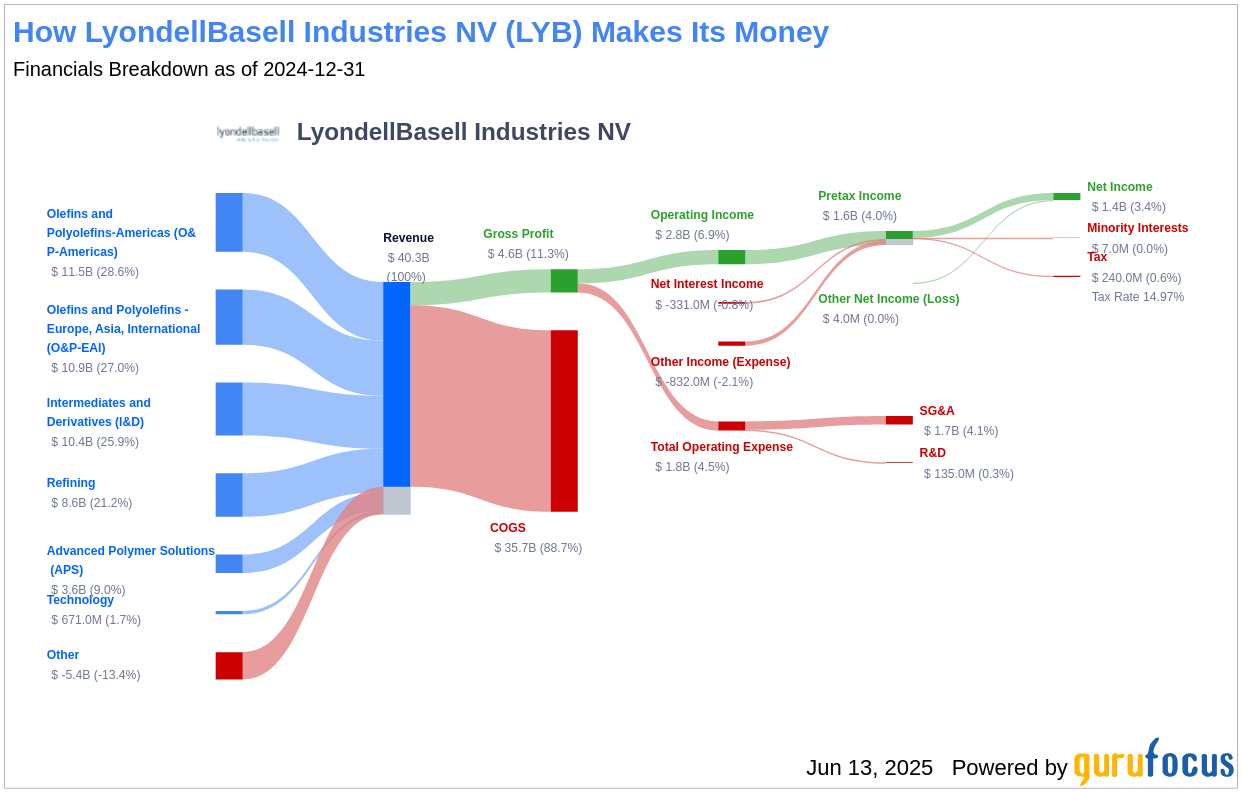
LyondellBasell Industries NV is a leading petrochemical producer with operations spanning the United States, Europe, and Asia. The company is the world's largest producer of polypropylene and a significant producer of polyethylene and propylene oxide. These chemicals are integral to various consumer and industrial products. A substantial portion of LyondellBasell's production is based in North America. The company boasts a market capitalization of $19.7 billion, with sales amounting to $38.05 billion and an operating margin of 5.72%.
Financial Strength Analysis
LyondellBasell Industries NV's financial strength metrics reveal some concerns regarding the company's balance sheet health. The interest coverage ratio stands at 4.72, which is lower than 66.72% of companies in the Chemicals industry. This ratio suggests potential difficulties in managing interest expenses on outstanding debt. Benjamin Graham, a renowned investor, typically preferred companies with an interest coverage ratio of at least five.
The company's Altman Z-Score is 2.27, below the safe threshold of 2.99, indicating potential financial struggles if it drops further. Additionally, the low cash-to-debt ratio of 0.15 highlights challenges in managing existing debt levels. The debt-to-Ebitda ratio of 4.21 exceeds Joel Tillinghast's warning level of 4, suggesting potential red flags unless tangible assets cover the debt.
Growth Prospects
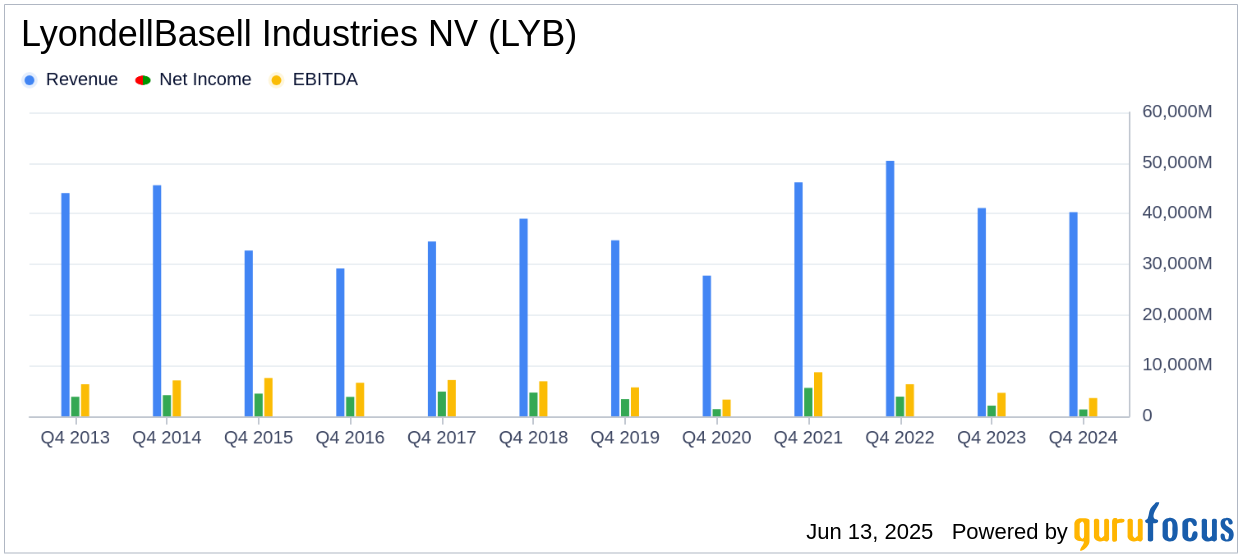
LyondellBasell Industries NV's growth prospects appear limited, as reflected in its low Growth rank. The company's revenue has declined by -3.7% annually over the past three years, underperforming 70.26% of companies in the Chemicals industry. This stagnation raises concerns in a rapidly evolving market.
Over the past five years, LyondellBasell Industries NV has experienced a decline in earnings before interest, taxes, depreciation, and amortization (EBITDA). The three-year growth rate is -24.8%, while the five-year growth rate is -3.1%. These figures highlight potential challenges in profitability. Furthermore, the company's predictability rank is just one star out of five, adding to investor uncertainty regarding revenue and earnings consistency.
Conclusion
In conclusion, LyondellBasell Industries NV's financial strength, profitability, and growth metrics, as highlighted by the GF Score, suggest potential underperformance. The company's challenges in managing debt, declining revenue, and limited growth prospects raise concerns for investors. As the market continues to evolve, LyondellBasell Industries NV must address these issues to maintain its competitive position. For investors seeking companies with strong GF Scores, GuruFocus Premium members can explore more options using the GF Score Screen.
This article, generated by GuruFocus, is designed to provide general insights and is not tailored financial advice. Our commentary is rooted in historical data and analyst projections, utilizing an impartial methodology, and is not intended to serve as specific investment guidance. It does not formulate a recommendation to purchase or divest any stock and does not consider individual investment objectives or financial circumstances. Our objective is to deliver long-term, fundamental data-driven analysis. Be aware that our analysis might not incorporate the most recent, price-sensitive company announcements or qualitative information. GuruFocus holds no position in the stocks mentioned herein.