

Baker Hughes (BKR, Financial) announced a decrease in the U.S. rig count, falling by four rigs from the previous week, resulting in a total of 555. This decline includes a reduction of three oil rigs, bringing the number to 439, while the count for gas rigs decreased by one to 113. The number of miscellaneous rigs remained constant at three.
Compared to the same period last year, the U.S. rig count has decreased by 35. Specifically, oil rigs have dropped by 49, although gas rigs have increased by 15, with miscellaneous rigs witnessing a minor reduction of one. The number of offshore rigs in the U.S. has also decreased, down by three to a total of 10, reflecting a year-on-year decrease of 11 rigs.
In contrast, Canada has seen an uptick in its rig count, rising by 24 from last week to reach a total of 138. This increase includes 22 additional oil rigs, now numbering 91, and an increase of two gas rigs, now totaling 47, with miscellaneous rigs unchanged at zero. However, this still marks a decline from last year's figures, which saw the Canadian count at 160, with reductions across oil, gas, and miscellaneous rigs.
Wall Street Analysts Forecast
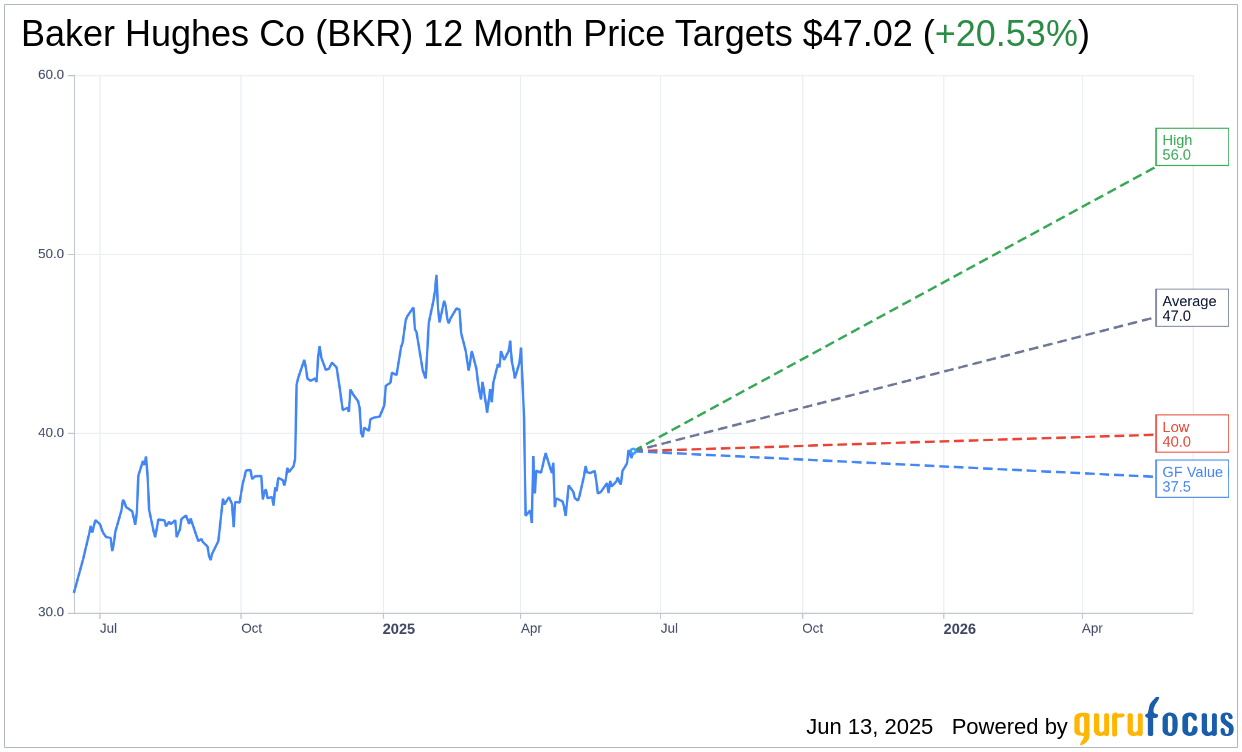
Based on the one-year price targets offered by 23 analysts, the average target price for Baker Hughes Co (BKR, Financial) is $47.02 with a high estimate of $56.00 and a low estimate of $40.00. The average target implies an upside of 20.53% from the current price of $39.01. More detailed estimate data can be found on the Baker Hughes Co (BKR) Forecast page.
Based on the consensus recommendation from 26 brokerage firms, Baker Hughes Co's (BKR, Financial) average brokerage recommendation is currently 1.9, indicating "Outperform" status. The rating scale ranges from 1 to 5, where 1 signifies Strong Buy, and 5 denotes Sell.
Based on GuruFocus estimates, the estimated GF Value for Baker Hughes Co (BKR, Financial) in one year is $37.48, suggesting a downside of 3.92% from the current price of $39.01. GF Value is GuruFocus' estimate of the fair value that the stock should be traded at. It is calculated based on the historical multiples the stock has traded at previously, as well as past business growth and the future estimates of the business' performance. More detailed data can be found on the Baker Hughes Co (BKR) Summary page.