

Stephens has increased its price target for GMS Inc. (GMS, Financial) from $90 to $95, while maintaining an Overweight rating on the stock. This decision follows GMS's performance in its fiscal fourth-quarter results and guidance for the first quarter. The firm expresses optimism regarding the company's robust results despite challenging economic conditions, suggesting that a period of lower demand may soon stabilize. Investors are informed that this adjustment reflects a positive outlook on GMS's future performance.
Wall Street Analysts Forecast
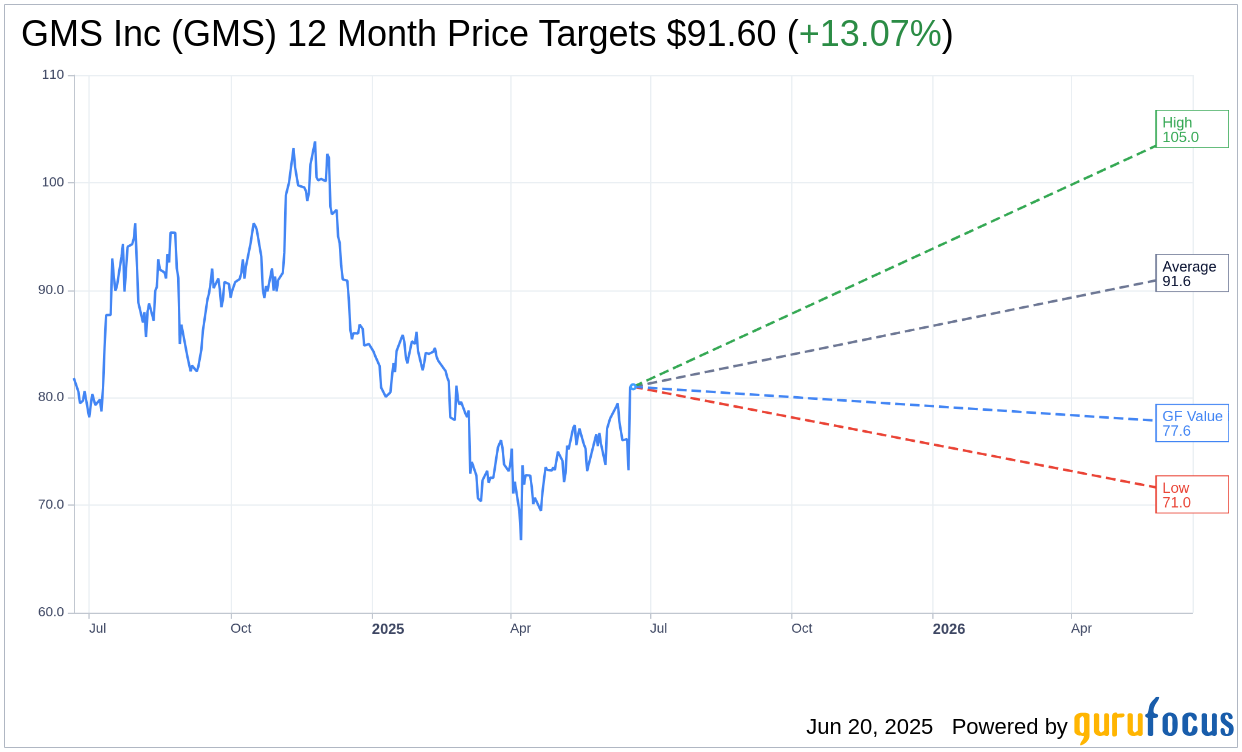
Based on the one-year price targets offered by 9 analysts, the average target price for GMS Inc (GMS, Financial) is $91.60 with a high estimate of $105.00 and a low estimate of $71.00. The average target implies an upside of 13.07% from the current price of $81.01. More detailed estimate data can be found on the GMS Inc (GMS) Forecast page.
Based on the consensus recommendation from 8 brokerage firms, GMS Inc's (GMS, Financial) average brokerage recommendation is currently 2.4, indicating "Outperform" status. The rating scale ranges from 1 to 5, where 1 signifies Strong Buy, and 5 denotes Sell.
Based on GuruFocus estimates, the estimated GF Value for GMS Inc (GMS, Financial) in one year is $77.64, suggesting a downside of 4.16% from the current price of $81.01. GF Value is GuruFocus' estimate of the fair value that the stock should be traded at. It is calculated based on the historical multiples the stock has traded at previously, as well as past business growth and the future estimates of the business' performance. More detailed data can be found on the GMS Inc (GMS) Summary page.
GMS Key Business Developments
Release Date: June 18, 2025
- Full Year Net Sales: $5.5 billion, up marginally compared to the prior year.
- Organic Sales: $5.2 billion, down 5.4% on a same-day basis compared to the prior year.
- Full Year Net Income: $115.5 million, inclusive of a $42.5 million noncash goodwill impairment charge.
- Adjusted EBITDA: $500.9 million.
- Free Cash Flow: $336.1 million, or 67% of adjusted EBITDA.
- Fourth Quarter Net Sales: $1.3 billion.
- Fourth Quarter Organic Sales Decline: 8.3% per day.
- Fourth Quarter Net Income: $26.1 million.
- Fourth Quarter Adjusted EBITDA: $109.8 million.
- Cash from Operating Activities (Q4): $196.8 million.
- Fourth Quarter Free Cash Flow: $183.4 million, or 167% of adjusted EBITDA.
- Cost Savings Program: $55 million in annualized cost savings during fiscal 2025.
- Net Debt Reduction: More than 10% during the quarter.
- Leverage Ratio: 2.4 times adjusted EBITDA.
- Share Repurchase: 348,600 shares for $26.4 million during the quarter.
For the complete transcript of the earnings call, please refer to the full earnings call transcript.
Positive Points
- GMS Inc (GMS, Financial) reported net sales of $5.5 billion for the full year, driven by positive contributions from recent acquisitions.
- The company achieved a record quarterly free cash flow conversion, with $183.4 million or 167% of adjusted EBITDA generated during the fourth quarter.
- Ceilings and Complementary Products saw volume improvement during the quarter, with Ceilings benefiting from strategic focus on Architectural Specialties projects.
- GMS Inc (GMS) implemented a significant cost savings program, achieving $55 million in annualized cost savings during fiscal 2025.
- The company reduced net debt by more than 10% during the quarter, maintaining a target debt leverage range of 1.5 to 2.5 times.
Negative Points
- Organic sales for the year were down 5.4% on a same-day basis compared to the prior year.
- Net income for the full year was impacted by a $42.5 million noncash goodwill impairment charge recorded in the third quarter.
- The company faced ongoing macroeconomic challenges, with organic sales declining 8.3% per day in the fourth quarter.
- Wallboard sales were down 10.1% year-over-year, with single-family volumes in the US down 1.9% per day.
- Commercial activity was negatively impacted by high interest rates and economic uncertainty, contributing to soft starts and mixed results.