
Lulu’s Fashion Lounge has announced that its board of directors has approved a 1-for-15 reverse stock split of its common stock, which holds a par value of $0.001 per share. This change is set to become effective on July 3. Following the split, trading on the Nasdaq will commence under the existing symbol, LVLU, from the start of business on July 7.
Wall Street Analysts Forecast
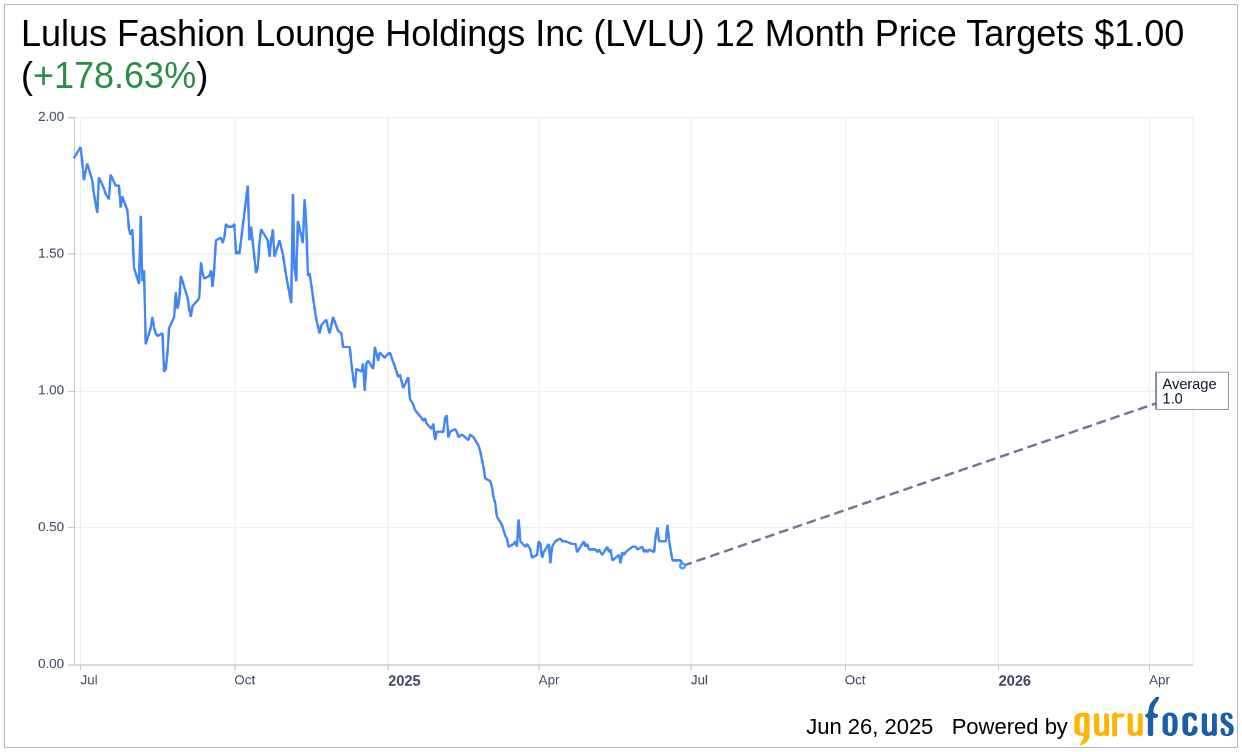
Based on the one-year price targets offered by 1 analysts, the average target price for Lulus Fashion Lounge Holdings Inc (LVLU, Financial) is $1.00 with a high estimate of $1.00 and a low estimate of $1.00. The average target implies an upside of 185.23% from the current price of $0.35. More detailed estimate data can be found on the Lulus Fashion Lounge Holdings Inc (LVLU) Forecast page.
Based on the consensus recommendation from 1 brokerage firms, Lulus Fashion Lounge Holdings Inc's (LVLU, Financial) average brokerage recommendation is currently 3.0, indicating "Hold" status. The rating scale ranges from 1 to 5, where 1 signifies Strong Buy, and 5 denotes Sell.
Based on GuruFocus estimates, the estimated GF Value for Lulus Fashion Lounge Holdings Inc (LVLU, Financial) in one year is $1.45, suggesting a upside of 313.58% from the current price of $0.3506. GF Value is GuruFocus' estimate of the fair value that the stock should be traded at. It is calculated based on the historical multiples the stock has traded at previously, as well as past business growth and the future estimates of the business' performance. More detailed data can be found on the Lulus Fashion Lounge Holdings Inc (LVLU) Summary page.
LVLU Key Business Developments
Release Date: May 14, 2025
- Net Revenue: $64.2 million, a decrease of 17% year-over-year.
- Gross Margin: 40.3%, down 200 basis points from the prior year.
- Net Loss: $8 million, compared to $5.7 million in the same period last year.
- Adjusted EBITDA Loss: $4.7 million, compared to a $2.7 million loss in Q1 2024.
- Adjusted EBITDA Margin: Negative 7.3% versus negative 3.4% in the prior year period.
- Net Cash Provided by Operating Activities: $8.3 million, a $1.4 million improvement year-over-year.
- Free Cash Flow: $7.8 million, reflecting a $1.8 million increase year-over-year.
- Net Debt: $1.5 million at the end of Q1, a $7.2 million reduction from the end of Q4 2024.
- Inventory Balance: $39.7 million, a 4% decrease year-over-year.
- Return Rates: Improved by 170 basis points, marking the third consecutive quarter of improvement.
- Product Margins: Increased 100 basis points versus the prior year period.
- Operating Expenses: Declined 12% year-over-year, with fixed costs down 16%.
- Selling and Marketing Expenses: $15.9 million, down about $1.8 million year-over-year.
- General and Administrative Expenses: Decreased $3.1 million to $18 million in Q1, a 15% decline year-over-year.
- Interest Expense: $577,000 versus $383,000 in Q1 2024.
- Diluted Loss Per Share: $0.19 compared to $0.15 in Q1 2024.
For the complete transcript of the earnings call, please refer to the full earnings call transcript.
Positive Points
- Lulus Fashion Lounge Holdings Inc (LVLU, Financial) saw strong sales momentum in occasion dresses, particularly in the bridesmaid category, contributing to healthy year-over-year net sales growth.
- The company exceeded expectations for cash flow and net debt reduction in the first quarter, strengthening its financial foundation.
- Product margins increased sequentially for the second consecutive quarter, with a 100 basis point improvement compared to the prior year.
- Return rates improved by 170 basis points, marking the third consecutive quarter of improvement, indicating successful enhancements in fit and quality.
- Wholesale revenue experienced triple-digit year-over-year growth, driven by strong partnerships with major partners and specialty retail momentum.
Negative Points
- The shoes and separate businesses continued to underperform, contributing significantly to the year-over-year decline in net sales.
- Profitability was pressured by the consolidation of distribution centers and related onetime costs, impacting the first quarter results.
- Net revenue decreased by 17% year-over-year, driven by a decrease in total orders placed and average order value.
- Gross margin for the quarter was down 200 basis points compared to the prior year, affected by lower efficiency in shipping costs.
- The company withdrew its previously issued fiscal year 2025 guidance for net revenue and adjusted EBITDA due to uncertainty related to international trade policy and tariffs.