
Advanced Micro Devices Inc (AMD, Financial) has recently been in the spotlight, drawing interest from investors and financial analysts due to its robust financial stance. With shares currently priced at $143.11, Advanced Micro Devices Inc has witnessed a daily loss of 0.49%, marked against a three-month change of 39.29%. A thorough analysis, underlined by the GF Score, suggests that Advanced Micro Devices Inc is well-positioned for substantial growth in the near future.
What Is the GF Score?
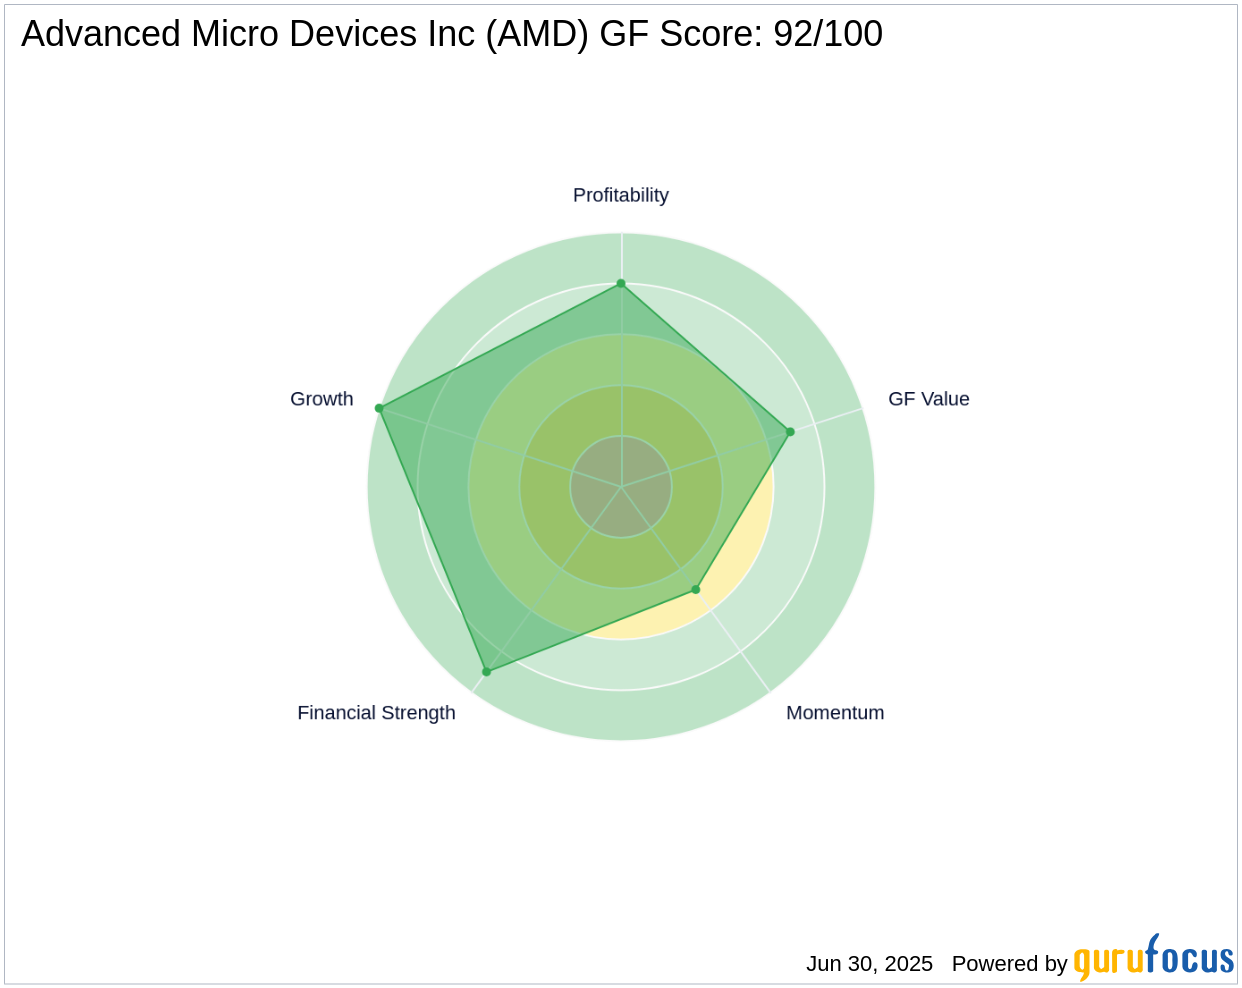
The GF Score is a stock performance ranking system developed by GuruFocus using five aspects of valuation, which has been found to be closely correlated to the long-term performances of stocks by backtesting from 2006 to 2021. The stocks with a higher GF Score generally generate higher returns than those with a lower GF Score. Therefore, when picking stocks, investors should invest in companies with high GF Scores. The GF Score ranges from 0 to 100, with 100 as the highest rank.
- Financial strength rank: 9/10
- Profitability rank: 8/10
- Growth rank: 10/10
- GF Value rank: 7/10
- Momentum rank: 5/10
Each one of these components is ranked and the ranks also have positive correlation with the long term performances of stocks. The GF score is calculated using the five key aspects of analysis. Through backtesting, we know that each of these key aspects has a different impact on the stock price performance. Thus, they are weighted differently when calculating the total score. With a high GF Score of 92 out of 100, Advanced Micro Devices Inc signals the highest outperformance potential.
Understanding Advanced Micro Devices Inc Business
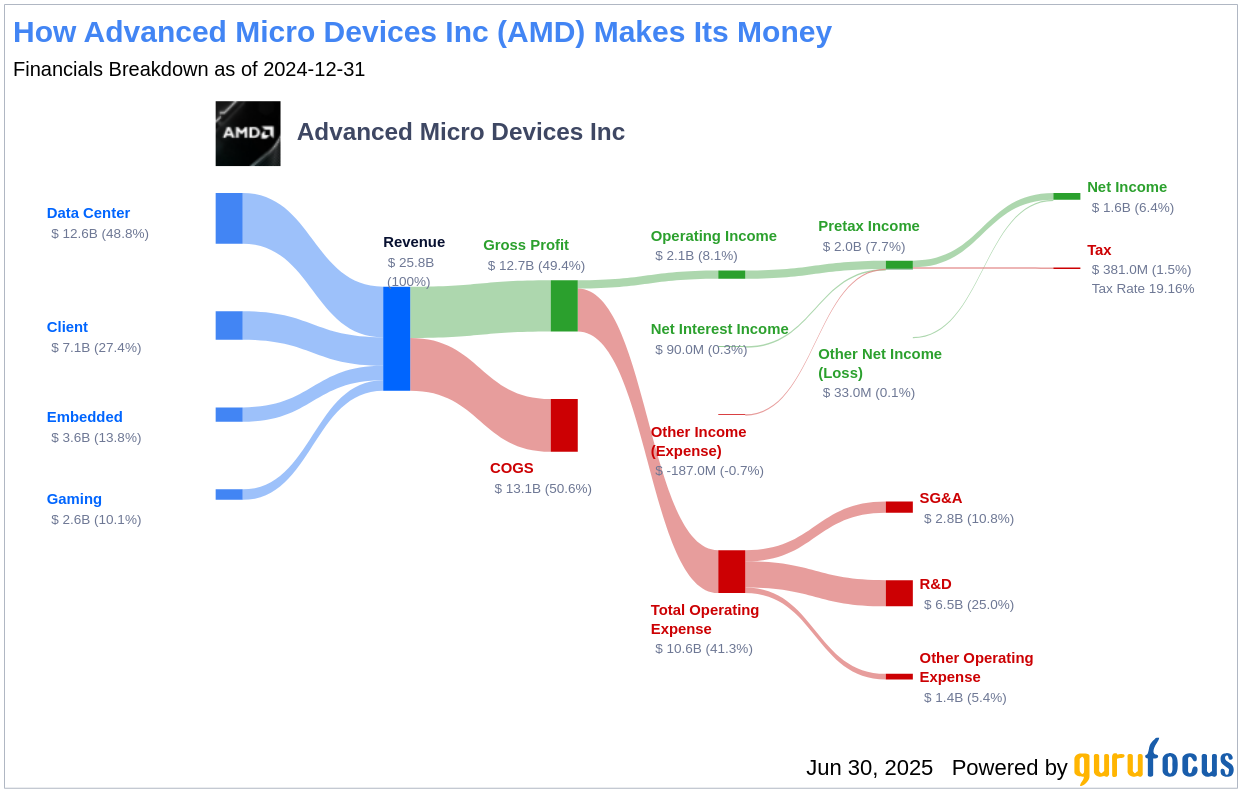
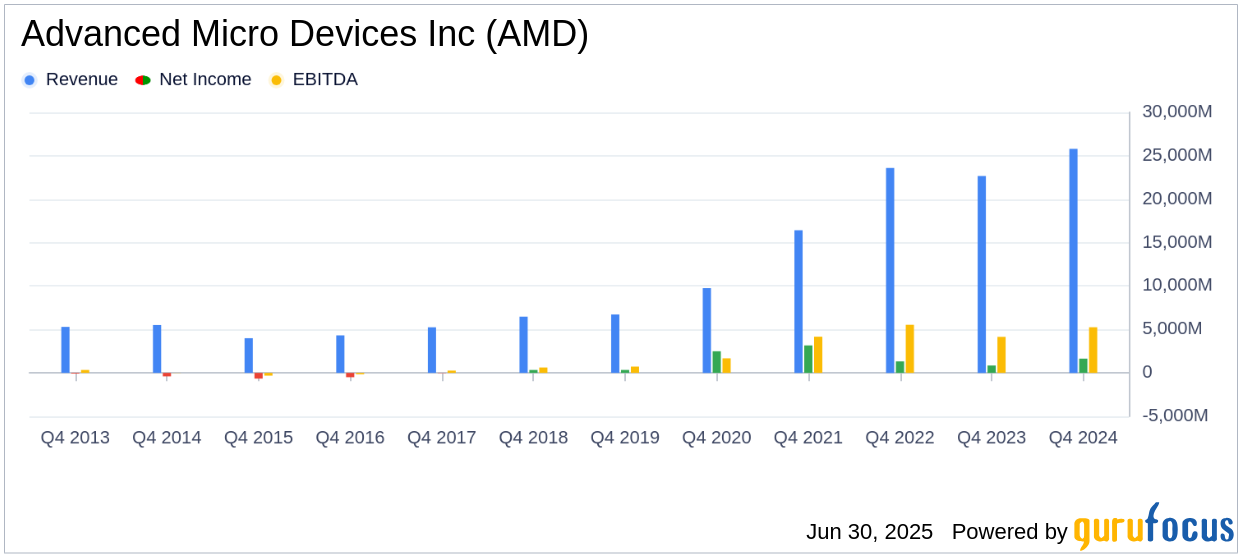
Advanced Micro Devices Inc designs a variety of digital semiconductors for markets such as PCs, gaming consoles, data centers, industrial, and automotive applications. AMD's traditional strength was in central processing units and graphics processing units used in PCs and data centers. Additionally, the firm supplies the chips found in prominent game consoles such as the Sony PlayStation and Microsoft Xbox. In 2022, the firm acquired field-programmable gate array leader Xilinx to diversify its business and augment its opportunities in key end markets such as data center and automotive. With a market cap of $232 billion and sales of $27.75 billion, Advanced Micro Devices Inc continues to expand its influence in the semiconductor industry.
Financial Strength Breakdown
According to the Financial Strength rating, Advanced Micro Devices Inc's robust balance sheet exhibits resilience against financial volatility, reflecting prudent management of capital structure. The Interest Coverage ratio for Advanced Micro Devices Inc stands impressively at 32.83, underscoring its strong capability to cover its interest obligations. This robust financial position resonates with the wisdom of legendary investor Benjamin Graham, who favored companies with an interest coverage ratio of at least 5. With an Altman Z-Score of 11.05, Advanced Micro Devices Inc exhibits a strong defense against financial distress, highlighting its robust financial stability. With a favorable Debt-to-Revenue ratio of 0.17, Advanced Micro Devices Inc's strategic handling of debt solidifies its financial health.
Profitability Rank Breakdown
The Profitability Rank shows Advanced Micro Devices Inc's impressive standing among its peers in generating profit. Furthermore, Advanced Micro Devices Inc's Gross Margin has seen a consistent rise over the past five years, as evidenced by the data: 2020: 44.53%; 2021: 48.25%; 2022: 44.93%; 2023: 46.12%; 2024: 49.35%. This trend underscores the company's growing proficiency in transforming revenue into profit. The Piotroski F-Score confirms Advanced Micro Devices Inc's solid financial situation based on Joseph Piotroski's nine-point scale, which measures a company's profitability, funding, and operating efficiency.
Growth Rank Breakdown
Ranked highly in Growth, Advanced Micro Devices Inc demonstrates a strong commitment to expanding its business. The company's 3-Year Revenue Growth Rate is 5.6%, which outperforms better than 63.43% of 968 companies in the Semiconductors industry.
Next Steps
Advanced Micro Devices Inc's financial strength, profitability, and growth metrics, as highlighted by the GF Score, underscore the firm's unparalleled position for potential outperformance. Investors seeking companies with strong financial health and growth potential may find Advanced Micro Devices Inc an attractive option. For those interested in exploring more companies with strong GF Scores, GuruFocus Premium members can utilize the following screener link: GF Score Screen.
This article, generated by GuruFocus, is designed to provide general insights and is not tailored financial advice. Our commentary is rooted in historical data and analyst projections, utilizing an impartial methodology, and is not intended to serve as specific investment guidance. It does not formulate a recommendation to purchase or divest any stock and does not consider individual investment objectives or financial circumstances. Our objective is to deliver long-term, fundamental data-driven analysis. Be aware that our analysis might not incorporate the most recent, price-sensitive company announcements or qualitative information. GuruFocus holds no position in the stocks mentioned herein.