

Lake Street has updated its outlook on One Stop Systems (OSS, Financial), increasing the stock's price target from $3.50 to $6 while maintaining a Buy rating. The adjustment follows positive discussions with the company's management, which highlighted promising prospects for long-term growth. The firm views One Stop Systems as a significant player poised to capture market share in the high-performance computing sector.
Wall Street Analysts Forecast
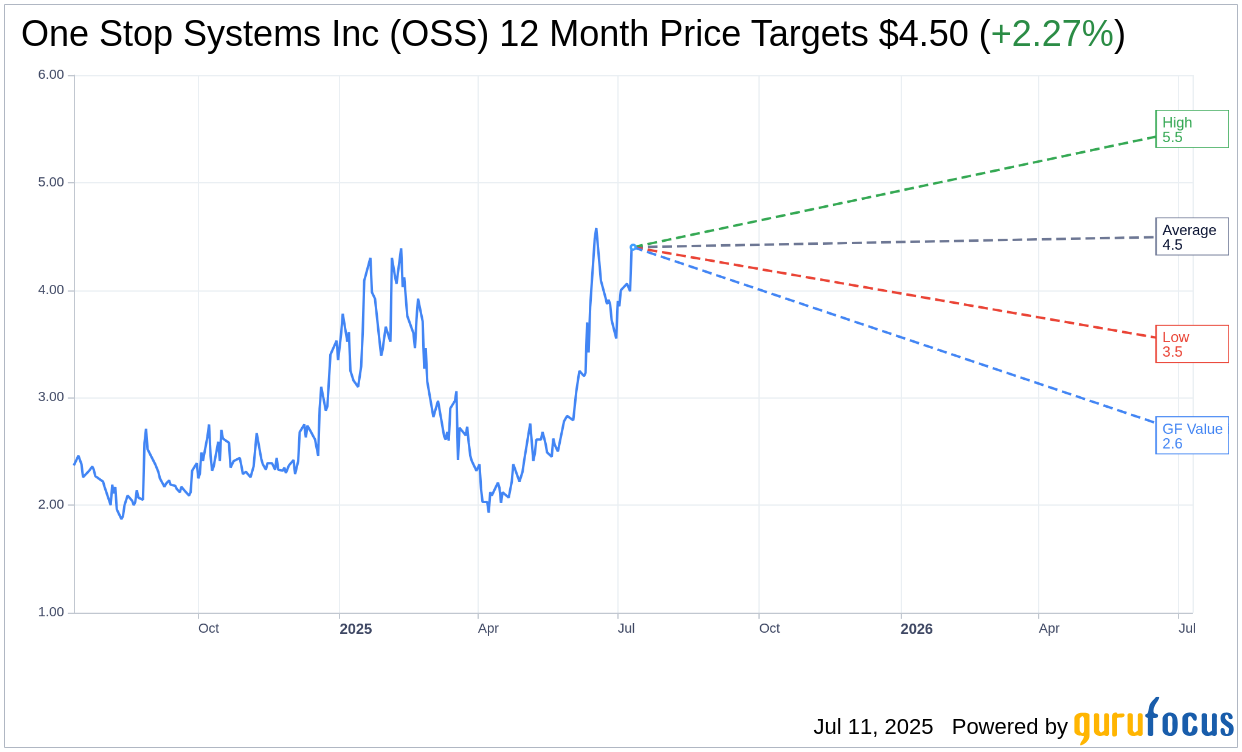
Based on the one-year price targets offered by 3 analysts, the average target price for One Stop Systems Inc (OSS, Financial) is $4.50 with a high estimate of $5.50 and a low estimate of $3.50. The average target implies an upside of 2.27% from the current price of $4.40. More detailed estimate data can be found on the One Stop Systems Inc (OSS) Forecast page.
Based on the consensus recommendation from 3 brokerage firms, One Stop Systems Inc's (OSS, Financial) average brokerage recommendation is currently 2.0, indicating "Outperform" status. The rating scale ranges from 1 to 5, where 1 signifies Strong Buy, and 5 denotes Sell.
Based on GuruFocus estimates, the estimated GF Value for One Stop Systems Inc (OSS, Financial) in one year is $2.65, suggesting a downside of 39.77% from the current price of $4.4. GF Value is GuruFocus' estimate of the fair value that the stock should be traded at. It is calculated based on the historical multiples the stock has traded at previously, as well as past business growth and the future estimates of the business' performance. More detailed data can be found on the One Stop Systems Inc (OSS) Summary page.
OSS Key Business Developments
Release Date: May 07, 2025
- Consolidated Revenue: $12.3 million, a 3.1% year-over-year decrease.
- Consolidated Gross Margin: Increased to 32.6% from 29.4% year-over-year.
- OSS Segment Gross Margin: Improved to 45.5% from 34.2% year-over-year.
- Brezner Segment Gross Margin: 23.1%, a 260 basis point decrease from the previous year.
- Operating Expenses: Increased 19.2% to $5.9 million year-over-year.
- GAAP Net Loss: $2 million or $0.09 per share, compared to a net loss of $1.3 million or $0.06 per share in the prior year.
- Non-GAAP Net Loss: $1.4 million or $0.07 per share, compared to $0.04 per share in the prior year.
- Adjusted EBITDA: Loss of $1.1 million compared to a loss of $500k in the prior year.
- Cash and Short-term Investments: $9.1 million as of March 30, 2025.
- Cash Used in Operating Activities: $1.1 million for the three months ended March 30, 2025.
- Book to Bill Ratio: 2.0 for the quarter, 1.33 trailing 12-month.
For the complete transcript of the earnings call, please refer to the full earnings call transcript.
Positive Points
- Consolidated gross margin increased by 320 basis points year over year to 32.6%, with the OSS segment achieving a strong gross margin of 45.5%.
- OSS announced a record contract award of $6.5 million with a large defense prime, alongside new multi-year relationships and renewals valued at $6 million.
- The company has a strong and growing pipeline of opportunities across defense and commercial markets, leveraging high-performance edge compute solutions.
- OSS segment experienced strong bookings with a book-to-bill ratio of 2.0 for the quarter, contributing to a trailing 12-month ratio of 1.33.
- The company is well-positioned to capitalize on multi-year growth opportunities driven by AI, machine learning, autonomy, and sensor fusion at the edge.
Negative Points
- Consolidated revenue decreased by 3.1% year over year, with lower revenue in both the OSS and Brezner segments.
- The company reported a GAAP net loss of $2 million, or $0.09 per share, compared to a net loss of $1.3 million in the prior year quarter.
- Adjusted EBITDA showed a loss of $1.1 million, compared to a loss of about $500k in the prior year first quarter.
- Operating expenses increased by 19.2% to $5.9 million, driven by higher marketing, selling, and R&D costs.
- Certain OSS segment orders were delayed due to near-term market conditions, affecting the timing of expected revenue.