

Mercury Systems (MRCY, Financial) has entered into two significant agreements with a major European defense contractor. These deals aim to enhance and speed up the manufacturing of processing subsystems and components specifically designed for radar and electronic warfare operations.
Earlier this year, in June, Mercury Systems fortified its longstanding partnership with this client by securing a five-year agreement. This contract facilitates the enhanced and expedited production of sensor processing subsystems. The systems are powered by Mercury’s HDS6605 6U OpenVPX multiprocessing boards, tailored for use across airborne, land-based, and sea-based radar systems.
Wall Street Analysts Forecast
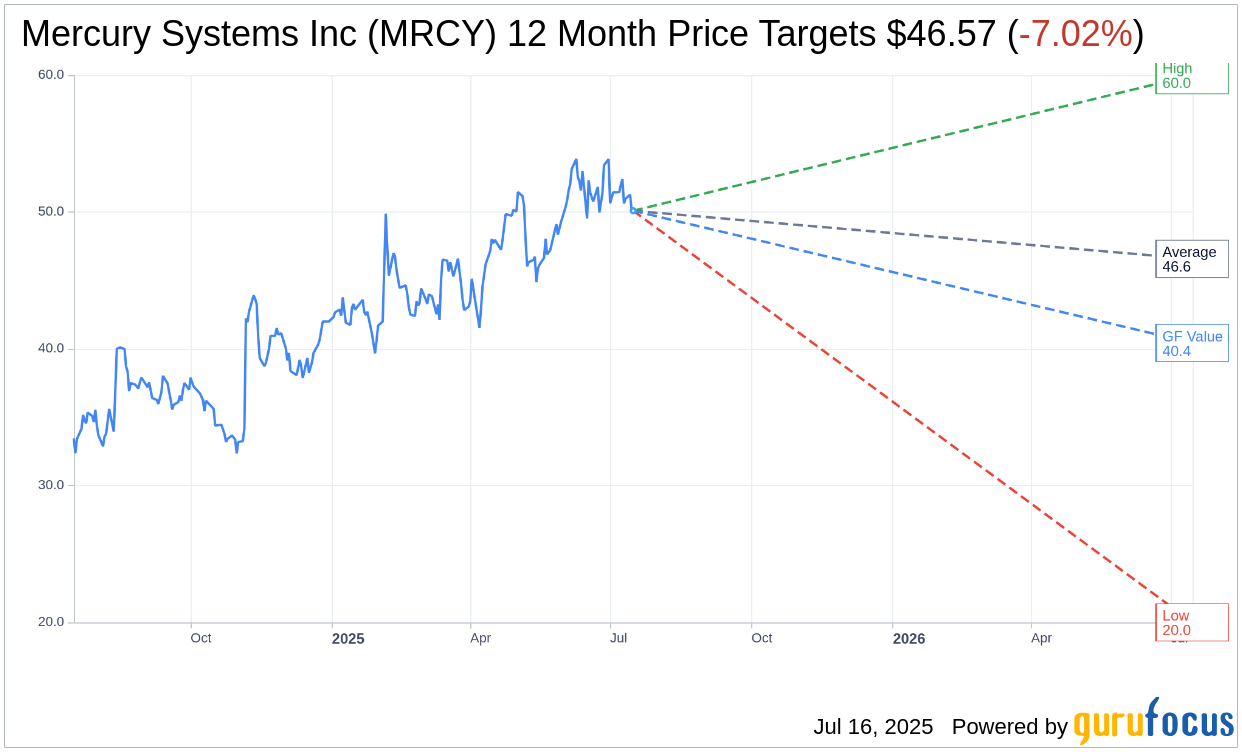
Based on the one-year price targets offered by 7 analysts, the average target price for Mercury Systems Inc (MRCY, Financial) is $46.57 with a high estimate of $60.00 and a low estimate of $20.00. The average target implies an downside of 7.02% from the current price of $50.09. More detailed estimate data can be found on the Mercury Systems Inc (MRCY) Forecast page.
Based on the consensus recommendation from 9 brokerage firms, Mercury Systems Inc's (MRCY, Financial) average brokerage recommendation is currently 2.6, indicating "Hold" status. The rating scale ranges from 1 to 5, where 1 signifies Strong Buy, and 5 denotes Sell.
Based on GuruFocus estimates, the estimated GF Value for Mercury Systems Inc (MRCY, Financial) in one year is $40.43, suggesting a downside of 19.29% from the current price of $50.09. GF Value is GuruFocus' estimate of the fair value that the stock should be traded at. It is calculated based on the historical multiples the stock has traded at previously, as well as past business growth and the future estimates of the business' performance. More detailed data can be found on the Mercury Systems Inc (MRCY) Summary page.
MRCY Key Business Developments
Release Date: May 06, 2025
- Revenue: $211 million, up 1.5% compared to prior year.
- Year-to-Date Revenue Growth: 8.9% year over year.
- Bookings: $200 million with a trailing 12-month book to bill of 1.1.
- Backlog: $1.34 billion, up 4% year-over-year.
- Gross Margin: 27%, increased from 19.5% in the same quarter last year.
- Adjusted EBITDA: $25 million with a margin of 11.7%.
- Free Cash Flow: $24 million, up $50 million year over year.
- Cash on Hand: $270 million at the end of Q3.
- Net Debt: $322 million, the lowest level since Q1 of FY22.
- Operating Expenses: Decreased by approximately $12 million year-over-year.
- GAAP Net Loss: $19 million with a loss per share of $0.33.
- Adjusted Earnings Per Share: $0.06 compared to an adjusted loss per share of $0.26 in the prior year.
- Working Capital: Decreased by $148 million year-over-year or 25%.
For the complete transcript of the earnings call, please refer to the full earnings call transcript.
Positive Points
- Mercury Systems Inc (MRCY, Financial) reported Q3 revenue of $211 million, reflecting a year-to-date growth of 8.9% year-over-year.
- The company achieved a trailing 12-month book-to-bill ratio of 1.1, indicating strong demand and future revenue potential.
- Adjusted EBITDA for Q3 was $25 million, with a margin of 11.7%, showing substantial improvement from the previous year.
- Free cash flow for the quarter was $24 million, up $50 million year-over-year, contributing to $146 million of free cash flow over the last four quarters.
- Mercury Systems Inc (MRCY) ended Q3 with $270 million in cash, demonstrating strong liquidity and financial health.
Negative Points
- The book-to-bill ratio for the quarter was 0.95, slightly below 1, indicating a potential slowdown in new orders.
- GAAP net loss for the third quarter was approximately $19 million, with a loss per share of $0.33.
- Operating expenses decreased by $12 million year-over-year, primarily due to lower R&D expenses and restructuring charges, which may impact future innovation.
- The company continues to burn off lower-margin backlog, which may affect profitability until higher-margin contracts are fully realized.
- Inventory levels increased slightly year-over-year, which could indicate potential inefficiencies in inventory management or slower-than-expected sales.