

Investors keen on following Citigroup (C, Financial) are increasingly turning to online platforms for timely updates on stock market movements. With the dynamic nature of the market, real-time data and insights are crucial for making informed investment choices. Online resources now offer tools and expert analyses that can aid in crafting effective strategies for navigating the financial landscape.
For those eager to enhance their investment strategies, embracing advanced investment tools and subscribing to expert guidance can provide a competitive edge. These platforms often offer insights into market trends and predictions, which can be especially beneficial for managing portfolios and identifying opportunities. By staying informed, investors in Citigroup (C, Financial) can make smarter and more confident decisions regarding their investments.
Wall Street Analysts Forecast
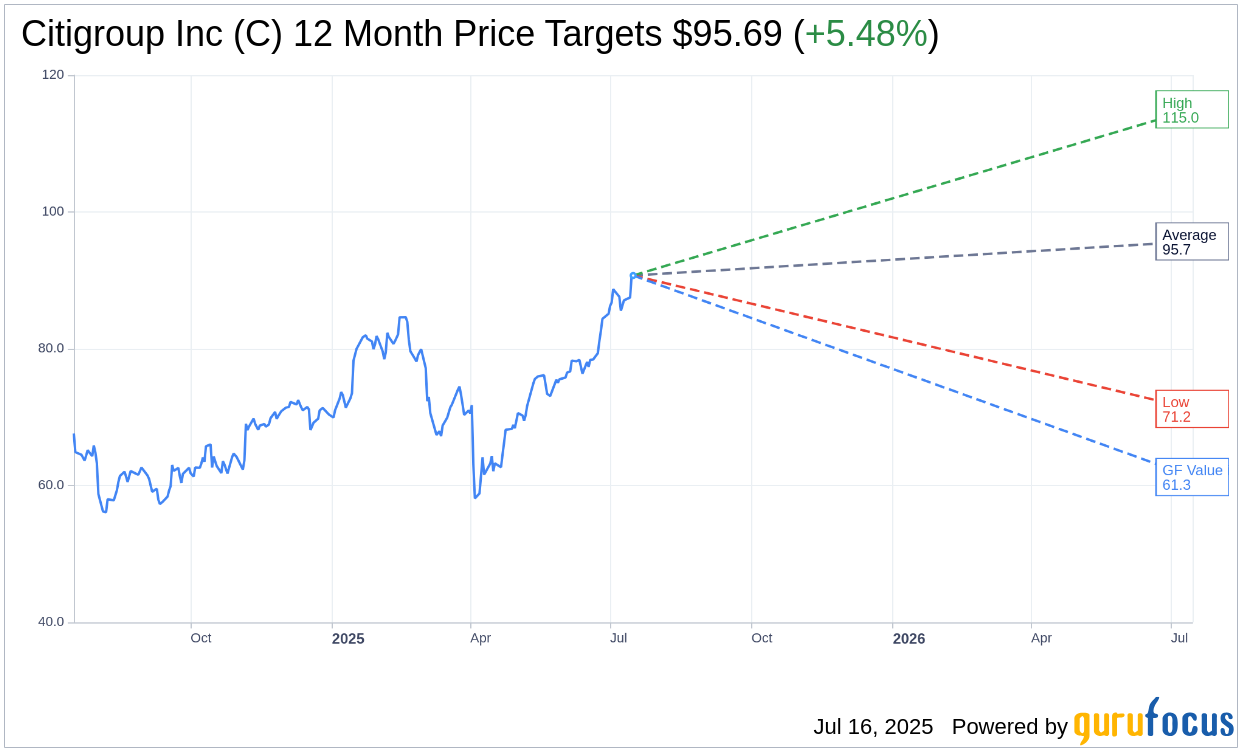
Based on the one-year price targets offered by 21 analysts, the average target price for Citigroup Inc (C, Financial) is $95.69 with a high estimate of $115.00 and a low estimate of $71.21. The average target implies an upside of 5.48% from the current price of $90.72. More detailed estimate data can be found on the Citigroup Inc (C) Forecast page.
Based on the consensus recommendation from 22 brokerage firms, Citigroup Inc's (C, Financial) average brokerage recommendation is currently 2.0, indicating "Outperform" status. The rating scale ranges from 1 to 5, where 1 signifies Strong Buy, and 5 denotes Sell.
Based on GuruFocus estimates, the estimated GF Value for Citigroup Inc (C, Financial) in one year is $61.26, suggesting a downside of 32.47% from the current price of $90.72. GF Value is GuruFocus' estimate of the fair value that the stock should be traded at. It is calculated based on the historical multiples the stock has traded at previously, as well as past business growth and the future estimates of the business' performance. More detailed data can be found on the Citigroup Inc (C) Summary page.
C Key Business Developments
Release Date: July 15, 2025
- Net Income: $4 billion.
- Earnings Per Share (EPS): $1.96.
- Return on Tangible Common Equity (RoTCE): 8.7%.
- Revenue: $21.7 billion, up 8% year-over-year.
- Services Revenue: Up 8% with a RoTCE of 23%.
- Markets Revenue: Up 16%, best second quarter since 2020.
- Wealth Revenue: Up 20% with a pre-tax margin of 29%.
- US Personal Banking Revenue: Up 6%.
- Common Equity Tier 1 Capital Ratio: 13.5%.
- Share Repurchases: $3.75 billion year-to-date as part of a $20 billion plan.
- Dividend: Increased to $0.60 per share starting in the third quarter.
- Expenses: $13.6 billion, up 2% year-over-year.
- Cost of Credit: $2.9 billion.
- Average Loans: Increased 3% sequentially.
- Average Deposits: Increased 3% driven by services.
For the complete transcript of the earnings call, please refer to the full earnings call transcript.
Positive Points
- Citigroup Inc (C, Financial) reported a strong quarter with net income of $4 billion and earnings per share of $1.96.
- Revenues increased by 8%, with three out of five business segments achieving record second-quarter revenues.
- The Services segment delivered a 23% RoTCE, with robust growth in loans and deposits.
- Markets revenues were up 16%, marking the best second quarter since 2020, driven by strong performance in fixed income and equities.
- The company returned over $3 billion in capital to shareholders, including $2 billion in share repurchases, and announced an increased dividend of $0.60 per share.
Negative Points
- Transformation expenses are expected to remain high, although they are anticipated to decrease next year.
- There is a slowdown in net new investment asset inflows in the Wealth segment due to macroeconomic uncertainty.
- Retail services faced pressure from lower sales activity at partners, impacting revenues.
- The company is still working on reducing stranded costs, with $1.2 billion remaining.
- The geopolitical and macroeconomic environment remains uncertain, impacting client activity and decision-making.