

Rexford Industrial (REXR, Financial) announced its second-quarter revenue, totaling $249.5 million, slightly below the expected $251.72 million. Despite this, the company continues to exhibit robust performance. The co-CEOs highlighted Rexford's adaptability in a fluctuating market, crediting the solid supply and demand dynamics in infill Southern California, along with the company's strong growth potential and financial stability. This strategic position and talented team are instrumental in consistently delivering value to their stakeholders.
Wall Street Analysts Forecast
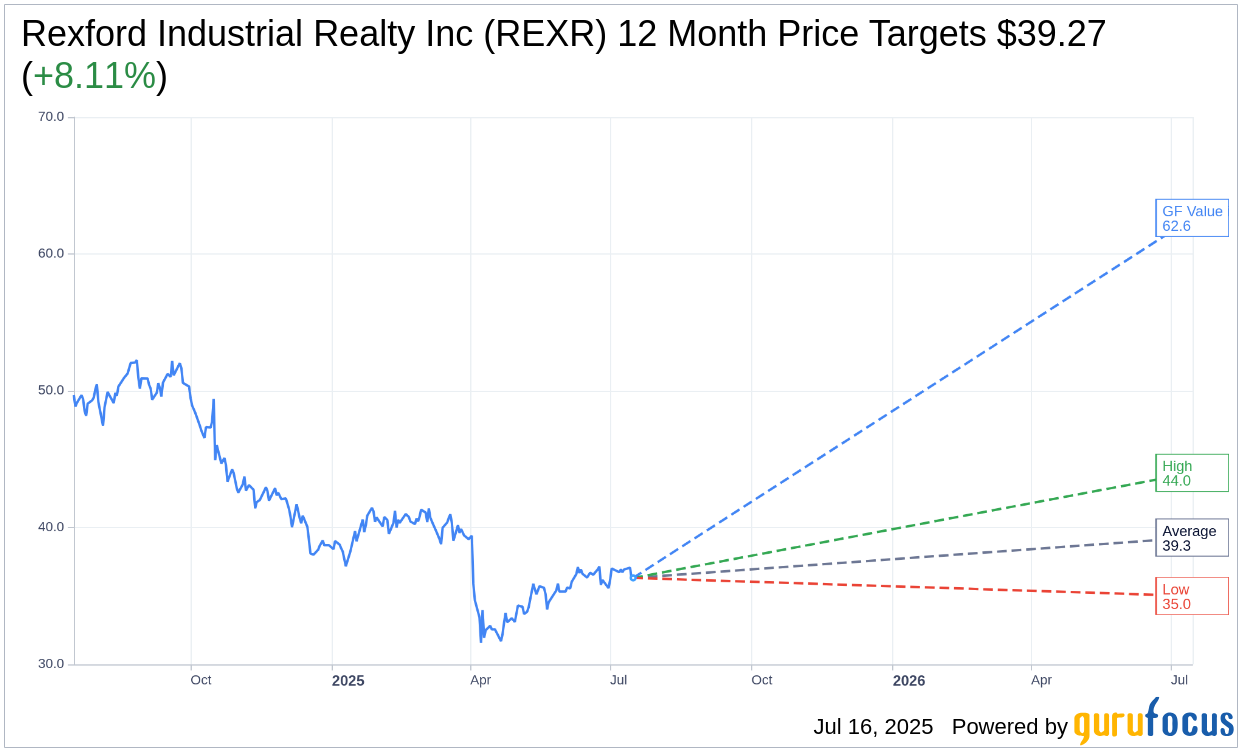
Based on the one-year price targets offered by 15 analysts, the average target price for Rexford Industrial Realty Inc (REXR, Financial) is $39.27 with a high estimate of $44.00 and a low estimate of $35.00. The average target implies an upside of 8.11% from the current price of $36.32. More detailed estimate data can be found on the Rexford Industrial Realty Inc (REXR) Forecast page.
Based on the consensus recommendation from 17 brokerage firms, Rexford Industrial Realty Inc's (REXR, Financial) average brokerage recommendation is currently 2.4, indicating "Outperform" status. The rating scale ranges from 1 to 5, where 1 signifies Strong Buy, and 5 denotes Sell.
Based on GuruFocus estimates, the estimated GF Value for Rexford Industrial Realty Inc (REXR, Financial) in one year is $62.64, suggesting a upside of 72.47% from the current price of $36.32. GF Value is GuruFocus' estimate of the fair value that the stock should be traded at. It is calculated based on the historical multiples the stock has traded at previously, as well as past business growth and the future estimates of the business' performance. More detailed data can be found on the Rexford Industrial Realty Inc (REXR) Summary page.
REXR Key Business Developments
Release Date: April 17, 2025
- Leases Executed: 2.4 million square feet with net effective and cash rent spreads of 24% and 15%, respectively.
- Embedded Rent Steps: Averaged 3.6% in executed leases.
- New Leasing Activity: 400,000 square feet from five repositioning and redevelopment projects.
- Overall Absorption: Positive 125,000 square feet.
- Tenant Retention: 82%, highest level over the past year.
- Market Rent Decline: 2.8% sequentially and 9.4% year-over-year.
- Core FFO: $0.62 per share, representing 7% growth sequentially and year-over-year.
- Projected Incremental NOI: Over $230 million embedded within the portfolio.
- Liquidity: More than $1.6 billion, including $608 million of cash.
- Net Debt to EBITDA: Reduced to 3.9 times.
- Credit Facility Recast: Extending duration, lowering interest expense, and increasing liquidity.
For the complete transcript of the earnings call, please refer to the full earnings call transcript.
Positive Points
- Rexford Industrial Realty Inc (REXR, Financial) executed 2.4 million square feet of leases with strong net effective and cash rent spreads of 24% and 15%, respectively.
- The company achieved an 82% tenant retention rate, the highest level over the past year.
- Rexford's portfolio outperformed the overall market in terms of rent declines, with smaller format spaces showing resilience.
- The company stabilized five repositioning projects totaling 560,000 square feet at a 7.6% unlevered yield.
- Rexford has over $230 million of projected incremental NOI embedded within its portfolio, positioning it for long-term growth.
Negative Points
- Market rents across Rexford's portfolio declined 2.8% sequentially and 9.4% year-over-year.
- The company is experiencing some excess supply in spaces above 100,000 square feet in certain submarkets.
- Leasing activity on vacant spaces decreased from 90% to 80% due to economic uncertainty and recent tariff announcements.
- Projected lease-up timing has increased to nine months from prior expectations of eight months due to tariff disruptions.
- Cash leasing spreads for the quarter were negatively impacted, primarily due to one lease with an above-market rent related to specialized improvements.