

F.N.B. Corporation (FNB, Financial) reported impressive financial performance for the second quarter, achieving record revenue of $438 million, surpassing market expectations of $424.37 million. The company's diluted earnings per share reached 36 cents, driven by notable growth in both net interest and non-interest income, which contributed to a 6.5% increase from the previous quarter. The pre-provision net revenue also saw a significant rise, marking a 16% growth compared to the prior quarter.
Strengthening its financial position, FNB's Common Equity Tier 1 (CET1) ratio climbed to 10.8%. Furthermore, there was a 13% year-over-year increase in tangible book value per share, reaching $11.14, and a tangible common equity ratio of 8.5%. The firm maintained a robust return on tangible common equity ratio of 14% during this period.
The company's balance sheet remained solid, with average loan and deposit growth annualized at 5.3% and 1.7% respectively. This growth was supported by FNB's wide-ranging geographic presence. Additionally, consistent underwriting and proactive credit risk management upheld the strong credit results. Emphasizing tech innovation, FNB's continued investment in digital strategies, including the "Clicks-to-Bricks" approach and the enhanced use of AI tools, positions it for future success.
Wall Street Analysts Forecast
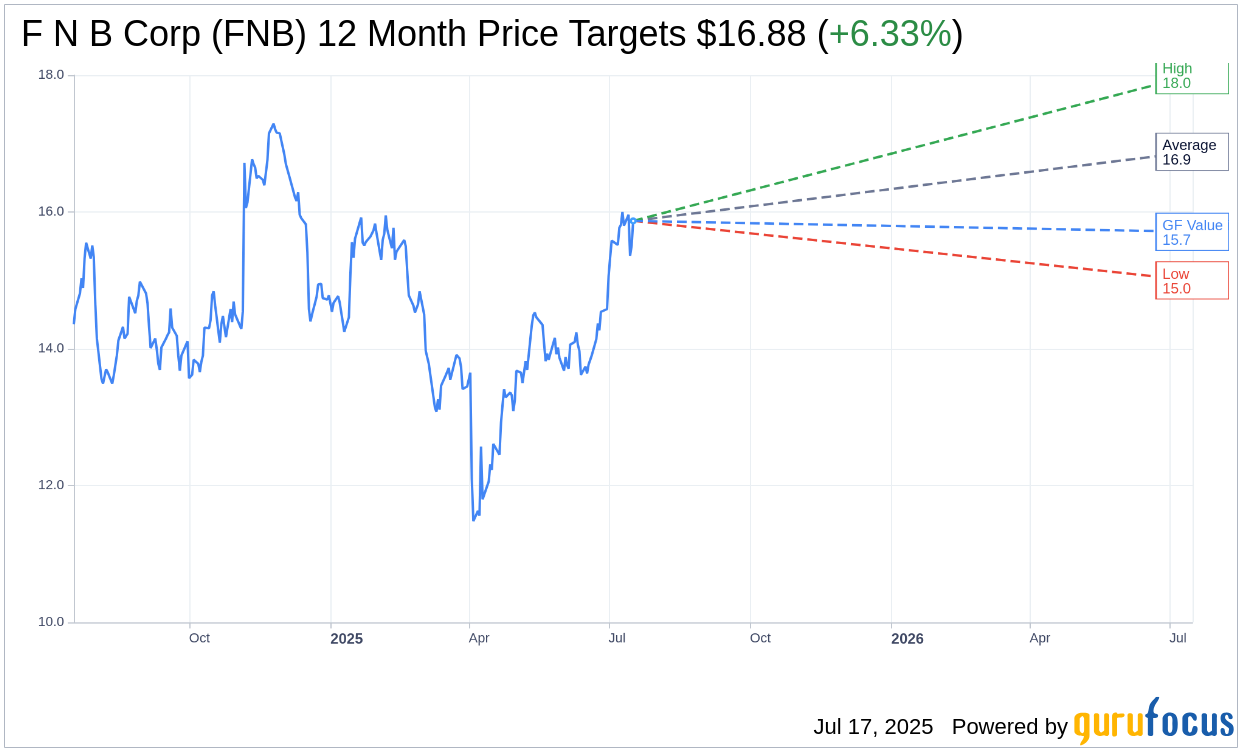
Based on the one-year price targets offered by 8 analysts, the average target price for F N B Corp (FNB, Financial) is $16.88 with a high estimate of $18.00 and a low estimate of $15.00. The average target implies an upside of 6.33% from the current price of $15.87. More detailed estimate data can be found on the F N B Corp (FNB) Forecast page.
Based on the consensus recommendation from 7 brokerage firms, F N B Corp's (FNB, Financial) average brokerage recommendation is currently 1.6, indicating "Outperform" status. The rating scale ranges from 1 to 5, where 1 signifies Strong Buy, and 5 denotes Sell.
Based on GuruFocus estimates, the estimated GF Value for F N B Corp (FNB, Financial) in one year is $15.71, suggesting a downside of 1.01% from the current price of $15.87. GF Value is GuruFocus' estimate of the fair value that the stock should be traded at. It is calculated based on the historical multiples the stock has traded at previously, as well as past business growth and the future estimates of the business' performance. More detailed data can be found on the F N B Corp (FNB) Summary page.
FNB Key Business Developments
Release Date: April 17, 2025
- Net Income: $116.5 million or $0.32 per share.
- Tangible Book Value Per Share: Increased by 12% to $10.83.
- CET1 Ratio: 10.7%.
- Tangible Common Equity to Tangible Assets: 8.4%.
- Total Revenue: $411.2 million.
- Noninterest Income: $87.8 million.
- Annualized Loan Growth: 3.5%.
- Annualized Deposit Growth: 1.4%.
- Total Loans and Leases: $34.2 billion.
- Total Deposits: $37.2 billion.
- Net Interest Margin: 3.03%.
- Net Interest Income: Nearly $324 million.
- Noninterest Expense: $246.8 million.
- Efficiency Ratio: 58.5%.
- Provision Expense: $18.6 million.
- Ending Funded Reserve: $429 million, 1.25% of total loans.
- NPL Coverage: 267%.
- Delinquency Rate: 75 basis points.
- Net Charge-Offs: 15 basis points.
For the complete transcript of the earnings call, please refer to the full earnings call transcript.
Positive Points
- F N B Corp (FNB, Financial) reported a net income of $116.5 million or $0.32 per share, indicating strong financial performance.
- The company achieved a 12% growth in tangible book value per share, reaching $10.83.
- FNB maintained record capital levels with a CET1 ratio of 10.7% and tangible common equity to tangible assets of 8.4%.
- The company demonstrated modest revenue growth, with total revenue reaching $411.2 million, driven by net interest income and solid noninterest income.
- FNB's strategic investments in high-value business units and digital banking enhancements, such as automated direct deposit switch capabilities, are expected to drive client acquisition and engagement.
Negative Points
- The macroeconomic environment remains uncertain, with potential impacts from tariffs and economic volatility posing risks to FNB's operations.
- Loan growth was modest, with annualized growth rates of 3.5% for loans and 1.4% for deposits, reflecting a slower pace in a seasonally weaker period.
- The company's capital markets income was impacted by lower commercial customer activity due to the current economic environment.
- FNB's noninterest expense increased due to higher salaries and employee benefits, driven by seasonal compensation expenses and strategic hiring.
- The company faces potential risks from tariffs, with less than 5% of its C&I and owner-occupied loan portfolio identified as at risk of greater impact.