

Guaranty Bancshares (GNTY, Financial) has reported a tangible book value per share of $26.29 for the second quarter. The company's net charge-offs stood at 0.05%, indicating robust financial health. Notably, the bank's earnings reached $10.0 million in this quarter, marking an increase of $2.6 million compared to the same period in 2024. This growth was largely attributed to an improvement in the net interest margin, which rose to 3.71% from 3.26% in the previous year.
The company saw stability in both core deposits and loan levels, with slight growth noted over the quarter. Asset quality remains strong, as evidenced by nonperforming assets comprising just 0.33% of total assets at the quarter's end. Guaranty Bancshares maintains high levels of liquidity and capital, reflecting its solid financial footing.
Wall Street Analysts Forecast
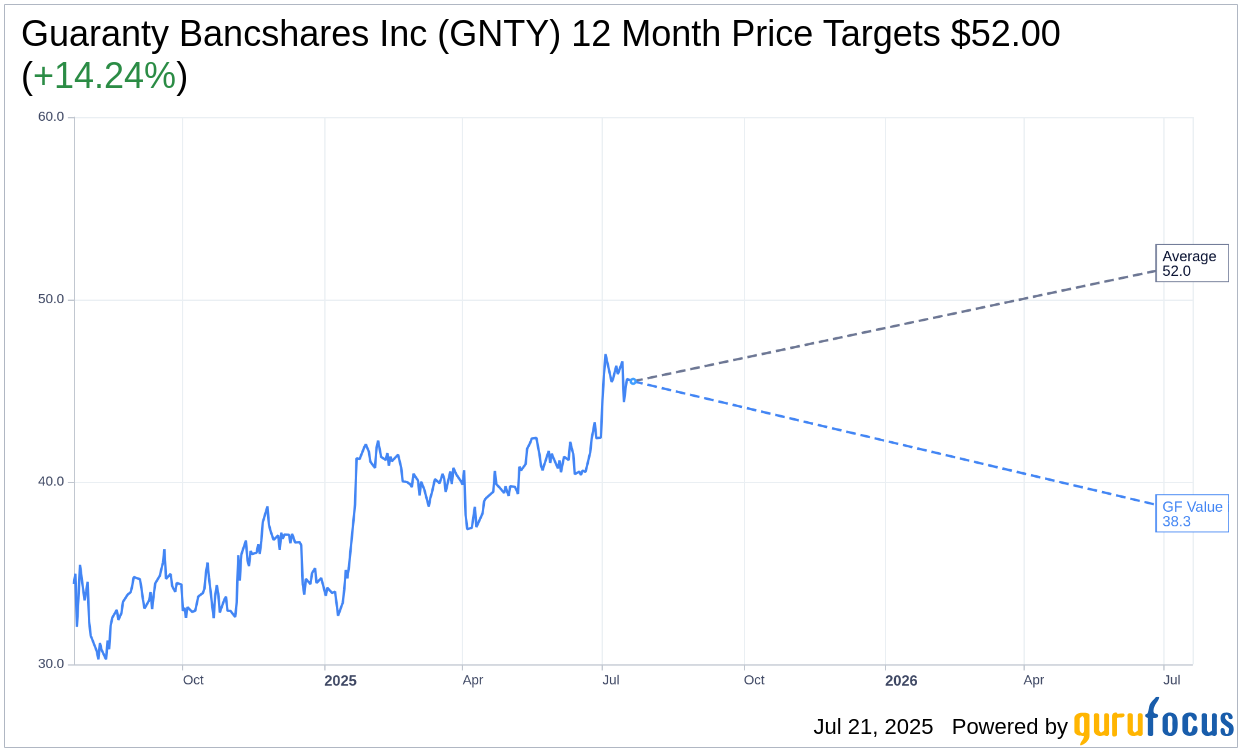
Based on the one-year price targets offered by 1 analysts, the average target price for Guaranty Bancshares Inc (GNTY, Financial) is $52.00 with a high estimate of $52.00 and a low estimate of $52.00. The average target implies an upside of 14.24% from the current price of $45.52. More detailed estimate data can be found on the Guaranty Bancshares Inc (GNTY) Forecast page.
Based on the consensus recommendation from 3 brokerage firms, Guaranty Bancshares Inc's (GNTY, Financial) average brokerage recommendation is currently 2.3, indicating "Outperform" status. The rating scale ranges from 1 to 5, where 1 signifies Strong Buy, and 5 denotes Sell.
Based on GuruFocus estimates, the estimated GF Value for Guaranty Bancshares Inc (GNTY, Financial) in one year is $38.28, suggesting a downside of 15.91% from the current price of $45.52. GF Value is GuruFocus' estimate of the fair value that the stock should be traded at. It is calculated based on the historical multiples the stock has traded at previously, as well as past business growth and the future estimates of the business' performance. More detailed data can be found on the Guaranty Bancshares Inc (GNTY) Summary page.
GNTY Key Business Developments
Release Date: April 21, 2025
- Total Assets Increase: $37 million during Q1 2025.
- Cash Increase: $72 million, primarily due to loan and securities-related cash flows.
- Deposit Increase: $12.2 million during the quarter.
- Net Loans Decrease: $23 million in Q1 2025.
- Securities Portfolio Decrease: $7.2 million overall.
- Net Income: $8.6 million for Q1 2025.
- Earnings Per Share (EPS): $0.76 per basic share.
- Return on Average Assets (ROA): 1.13% for the quarter.
- Return on Average Equity (ROE): 10.83% for the quarter.
- Net Interest Margin (NIM): 3.7% in Q1 2025.
- Noninterest Income Decrease: $693,000 compared to Q4 2024.
- Noninterest Expense Increase: $1.3 million in Q1 2025.
- Efficiency Ratio: 66.78% for the quarter.
- Nonperforming Assets to Total Assets: 0.15% at March 31, 2025.
- Net Charge-Offs: 0.02% in Q1 2025.
- Allowance for Credit Losses (ACL) Coverage: 1.32% of total loans.
- Liquidity Ratio: 19.8% at quarter end.
- Total Equity to Average Assets: 10.5% as of March 31, 2025.
- Tangible Common Equity (TCE) to Total Assets: 9.37%.
For the complete transcript of the earnings call, please refer to the full earnings call transcript.
Positive Points
- Guaranty Bancshares Inc (GNTY, Financial) reported a strong loan pipeline for Q2, indicating potential growth in the coming months.
- The company's net interest margin increased to 3.7% in Q1 2025, up from 3.54% in the previous quarter.
- Total assets increased by $37 million during the first quarter, with cash up nearly $72 million.
- The company repurchased shares and increased its dividend to $0.25 per share, reflecting confidence in its financial position.
- Guaranty Bancshares Inc (GNTY) maintains a strong liquidity position with a liquidity ratio of 19.8% and contingent liquidity of about $1.3 billion.
Negative Points
- Net loans decreased by $23 million in Q1 2025, indicating a contraction in the loan book.
- Noninterest income decreased by $693,000 compared to the previous quarter, primarily due to lower rental income and gains on property sales.
- Noninterest expense increased by $1.3 million, driven by employee compensation and related benefits.
- Return on average assets and return on average equity both declined compared to the previous quarter.
- The company's nonaccrual loans increased slightly to $4.8 million, representing 0.23% of total loans.