

Citi has upgraded its rating for UP Fintech (TIGR, Financial) from Neutral to Buy, raising the price target from $9.50 to $14. The firm sees significant valuation potential for TIGR, noting that it has not undergone the same level of re-rating as its competitor, Futu Holdings. Citi forecasts an annual revenue growth rate of 24% for UP Fintech through 2027. This optimistic outlook is supported by stronger-than-anticipated performance in the U.S. and Hong Kong markets, along with the potential for the company's new cryptocurrency business to boost trading activities among retail clients.
Wall Street Analysts Forecast
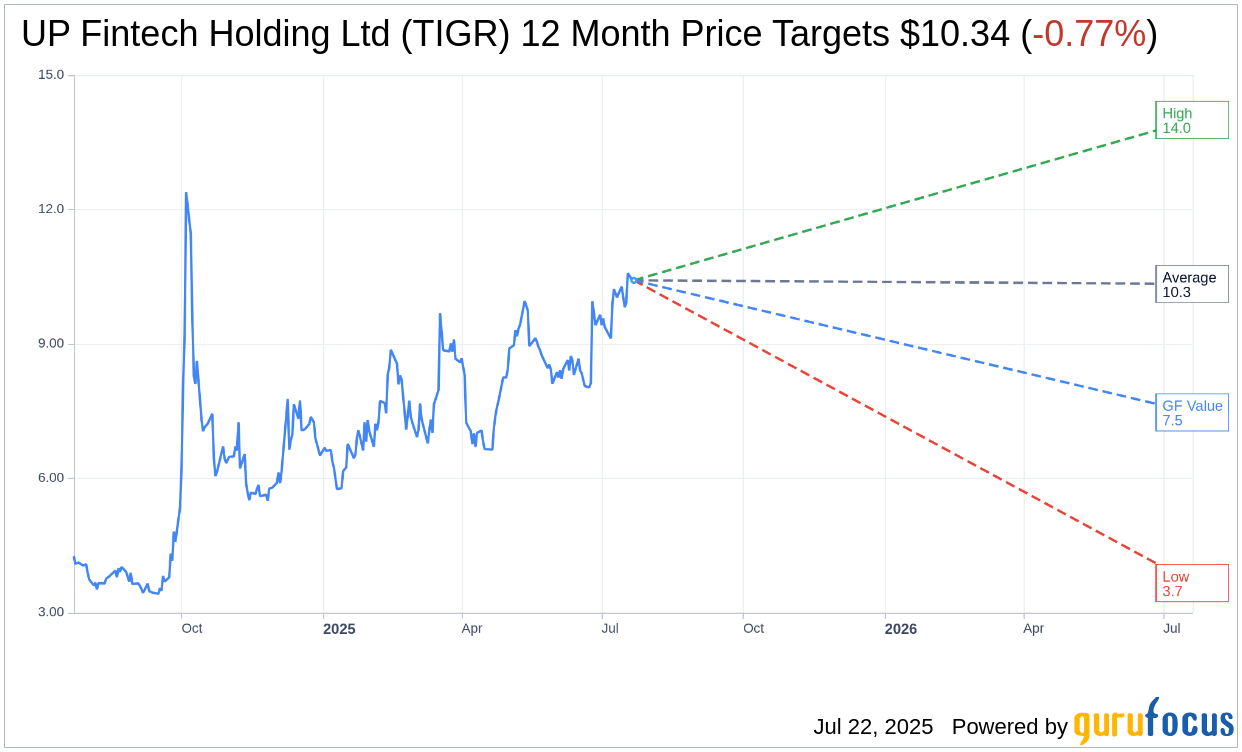
Based on the one-year price targets offered by 7 analysts, the average target price for UP Fintech Holding Ltd (TIGR, Financial) is $10.34 with a high estimate of $14.00 and a low estimate of $3.66. The average target implies an downside of 0.77% from the current price of $10.42. More detailed estimate data can be found on the UP Fintech Holding Ltd (TIGR) Forecast page.
Based on the consensus recommendation from 8 brokerage firms, UP Fintech Holding Ltd's (TIGR, Financial) average brokerage recommendation is currently 2.1, indicating "Outperform" status. The rating scale ranges from 1 to 5, where 1 signifies Strong Buy, and 5 denotes Sell.
Based on GuruFocus estimates, the estimated GF Value for UP Fintech Holding Ltd (TIGR, Financial) in one year is $7.47, suggesting a downside of 28.31% from the current price of $10.42. GF Value is GuruFocus' estimate of the fair value that the stock should be traded at. It is calculated based on the historical multiples the stock has traded at previously, as well as past business growth and the future estimates of the business' performance. More detailed data can be found on the UP Fintech Holding Ltd (TIGR) Summary page.
TIGR Key Business Developments
Release Date: May 30, 2025
- Total Revenue: USD 122.6 million, up 55.3% year over year.
- Commission Income: USD 58.3 million, more than doubling year over year.
- Interest Income: USD 53.8 million, increased 22.7% year over year.
- Non-GAAP Net Income: USD 36 million, up 18.3% sequentially and 145% year over year.
- GAAP Net Income: USD 30.4 million, up 8.4% quarter over quarter and 146.7% year over year.
- Total Trading Volume: USD 217 billion.
- Marketing, Financing, and Securities Lending Balance: USD 5.2 billion, increased 89.4% year over year.
- New Funded Accounts: 60,900 added in the first quarter, a 2.9% increase quarter-over-quarter and 111.2% growth year over year.
- Total Funded Accounts: 1,152,900, an increase of 23.5% year over year.
- Total Client Assets: USD 45.9 billion, up 9.9% quarter-over-quarter and 39.5% year-over-year.
- Interest Expense: USD 50 million, decreased 10% quarter over quarter.
- Employee Compensation and Benefits Expense: USD 33.8 million, an increase of 22% year over year.
- Marketing Expense: USD 10.9 million, increased 148% year-over-year.
- Total Operating Costs: USD 67.1 million, an increase of 32% from the same quarter of last year.
- Non-GAAP Profit Margin: Expanded from 25% in the previous quarter to nearly 30% this quarter.
For the complete transcript of the earnings call, please refer to the full earnings call transcript.
Positive Points
- Total revenue for the first quarter reached USD122.6 million, marking a 55.3% increase year over year.
- Trading volume hit USD217 billion, driving commission income to a record high of USD58.3 million, more than doubling year over year.
- Non-GAAP net income increased to USD36 million, reflecting an 18.3% sequential increase and a 145% increase year over year.
- The company added 60,900 new funded accounts in Q1, achieving over 40% of its full-year target.
- Client assets reached a record high of USD45.9 billion, marking the 10th consecutive quarter of growth.
Negative Points
- Interest income slightly decreased by 4% quarter over quarter due to the maturity of US treasury holdings.
- Cash equities take rate decreased slightly from 6.9 bps to 6.7 bps quarter over quarter.
- Execution and carrying expenses increased by 139% year over year, in line with increased trading volumes.
- Marketing expenses rose by 148% year over year, reflecting higher costs for user acquisition.
- The average customer acquisition cost (CAC) is expected to rise to USD250 to USD300, up from USD150 to USD180.