

- Texas Instruments (TXN, Financial) outperformed Q2 earnings estimates but experienced a 3.7% stock decline.
- Q3 revenue is projected between $4.45 billion and $4.80 billion, while analysts maintain a 'Hold' recommendation.
- Despite positive earnings, forecast metrics suggest potential downsides for investors.
Texas Instruments (TXN) unveiled its Q2 financial performance, reporting earnings per share of $1.41, which surpassed analyst expectations by $0.08. The company achieved revenues of $4.45 billion, reflecting a notable 16.5% year-over-year increase, outpacing predictions by $130 million. However, this strong performance didn't save the stock from a 3.7% drop, as investors seemed to be cautious about future expectations. For the upcoming third quarter, Texas Instruments anticipates revenue to range between $4.45 billion and $4.80 billion.
Wall Street Analysts Forecast
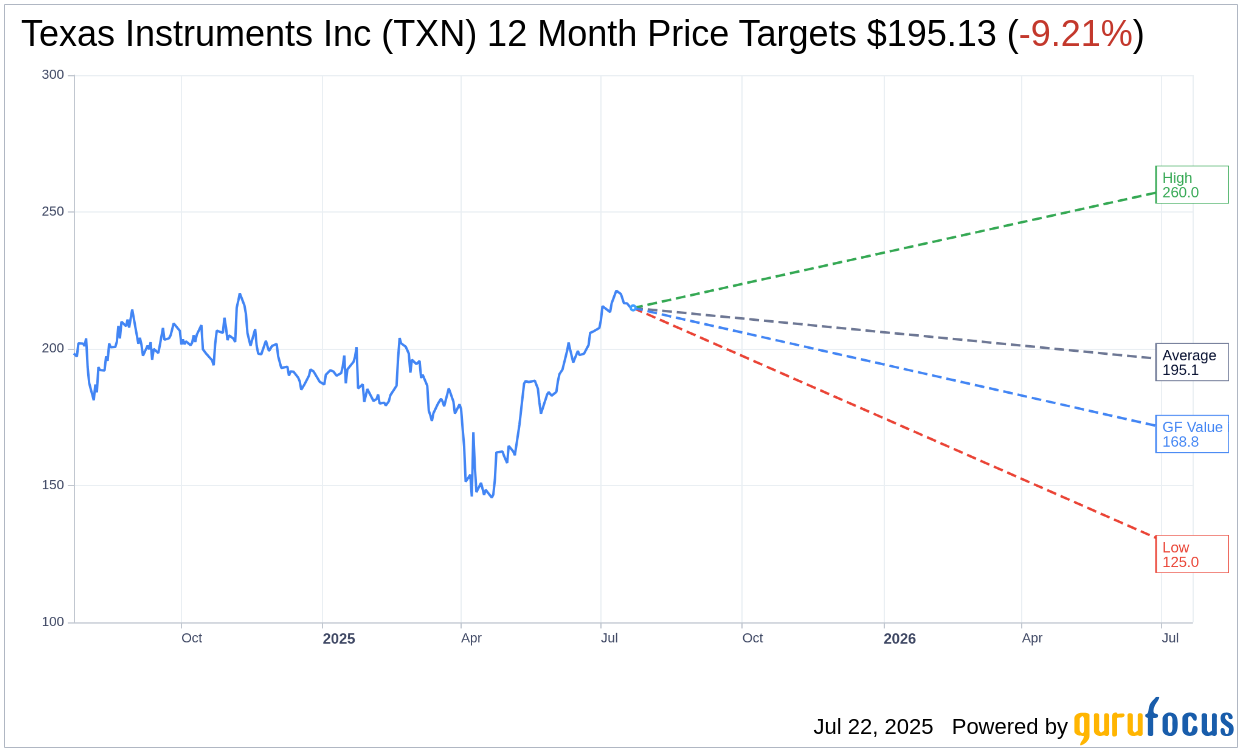
Market analysts remain cautious as evidenced by the one-year price targets provided by 32 professionals covering Texas Instruments Inc (TXN, Financial). The average price target stands at $195.13, with a range stretching from a high of $260.00 to a low of $125.00. This average target suggests a potential downside of 9.21% from the current market price of $214.92. For an in-depth analysis and further estimates, investors can visit the Texas Instruments Inc (TXN) Forecast page.
The consensus recommendation among 41 brokerage firms currently rates Texas Instruments Inc (TXN, Financial) as a 2.7 on a scale where 1 signals a 'Strong Buy' and 5 signifies a 'Sell.' This rating indicates a 'Hold' position, reflecting measured optimism amidst market uncertainties.
GuruFocus Metrics and Valuation
According to GuruFocus estimates, the GF Value for Texas Instruments Inc (TXN, Financial) over the next year is assessed at $168.85. This valuation presents a potential downside of 21.44% from the prevailing price of $214.92. The GF Value is calculated through a combination of historical multiples, previous business growth patterns, and projected future performance outcomes. Interested investors can explore more comprehensive data on the Texas Instruments Inc (TXN) Summary page.
For those closely monitoring the tech sector, Texas Instruments' current market evaluations, despite the robust quarterly performance, suggest deliberation in investment decisions. Understanding these trends and projections will be crucial for informed decision-making in the ever-evolving semiconductor industry.