

On July 22, 2025, Loop Capital analyst Mark Schappel announced an update concerning Manhattan Associates (MANH, Financial), maintaining a "Hold" rating for the stock. This follows the analyst's previous rating, which was also "Hold".
In addition to maintaining the current rating, Loop Capital has raised the price target for Manhattan Associates (MANH, Financial) from a prior value of $170.00 to a new target of $200.00 USD. This adjustment represents a notable increase of 17.65% in the price target.
The update comes as Loop Capital continues to monitor the performance and market conditions surrounding Manhattan Associates (MANH, Financial), adjusting expectations to reflect current economic forecasts and company performance metrics.
Investors and stakeholders should take note of this updated price target as they consider their positions and strategies involving Manhattan Associates (MANH, Financial) moving forward.
Wall Street Analysts Forecast
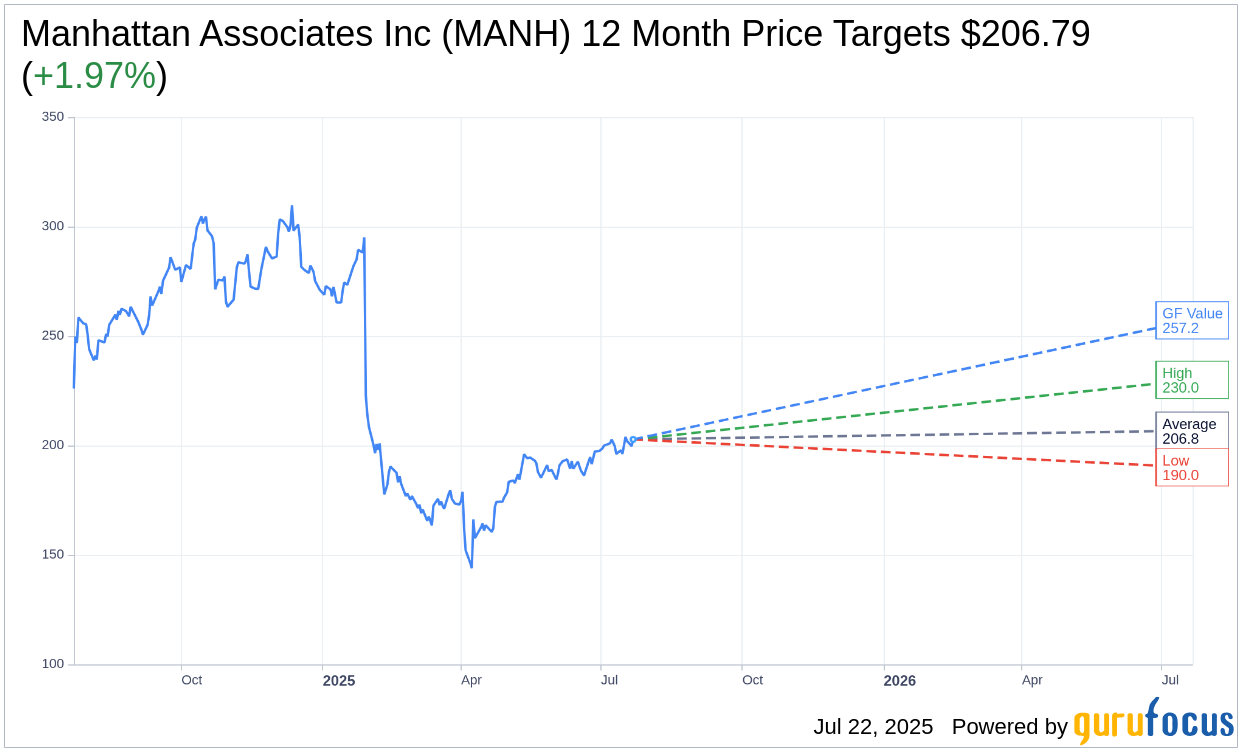
Based on the one-year price targets offered by 9 analysts, the average target price for Manhattan Associates Inc (MANH, Financial) is $206.79 with a high estimate of $230.00 and a low estimate of $190.00. The average target implies an upside of 1.97% from the current price of $202.79. More detailed estimate data can be found on the Manhattan Associates Inc (MANH) Forecast page.
Based on the consensus recommendation from 11 brokerage firms, Manhattan Associates Inc's (MANH, Financial) average brokerage recommendation is currently 2.4, indicating "Outperform" status. The rating scale ranges from 1 to 5, where 1 signifies Strong Buy, and 5 denotes Sell.
Based on GuruFocus estimates, the estimated GF Value for Manhattan Associates Inc (MANH, Financial) in one year is $257.20, suggesting a upside of 26.83% from the current price of $202.79. GF Value is GuruFocus' estimate of the fair value that the stock should be traded at. It is calculated based on the historical multiples the stock has traded at previously, as well as past business growth and the future estimates of the business' performance. More detailed data can be found on the Manhattan Associates Inc (MANH) Summary page.