

Key Highlights:
- Chubb's Q2 earnings surpassed analyst expectations with a core operating EPS of $6.14.
- Despite a record underwriting income of $1.63 billion, shares dipped slightly post-earnings report.
- Analyst consensus suggests a potential upside, though GF Value indicates a possible downside.
Impressive Earnings in Q2 for Chubb Ltd (CB, Financial)
Chubb Ltd (NYSE: CB) delivered a remarkable performance in the second quarter, reporting a core operating earnings per share (EPS) of $6.14, which exceeded the anticipated $5.97. This underscores a strong operational presence, particularly with record-setting property and casualty underwriting income amounting to $1.63 billion—a testament to the company's robust growth trajectory. Despite this stellar financial display, Chubb shares experienced a minor decline of 0.7% in after-hours trading, highlighting the often volatile nature of market reactions.
Wall Street Analyst Insights
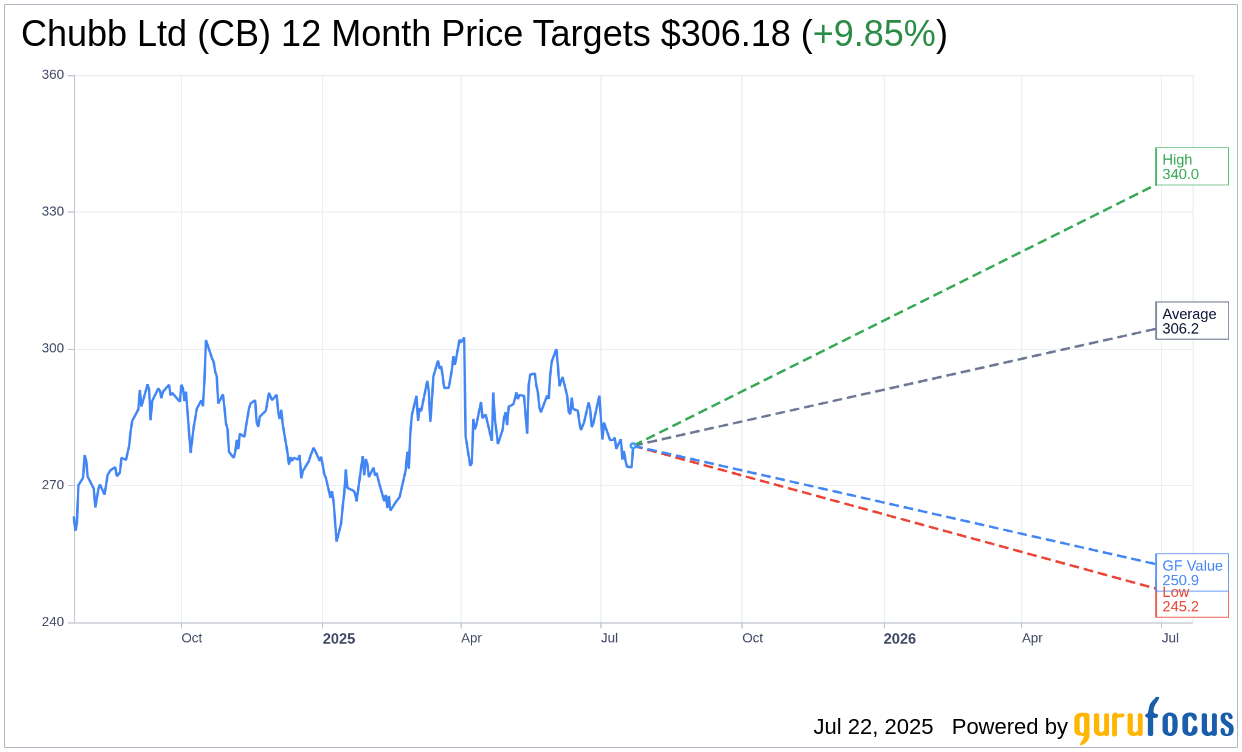
According to projections from 18 Wall Street analysts, Chubb Ltd (CB, Financial) has an average target price of $306.18. The forecasts range from a high of $340.00 to a low of $245.22, suggesting an average upside potential of 9.85% from its current trading value of $278.73. Investors can explore more detailed projections on the Chubb Ltd (CB) Forecast page.
The consensus from 23 brokerage firms currently positions Chubb Ltd (CB, Financial) with an "Outperform" rating, translating to an average recommendation score of 2.5. This rating scale ranges from 1 (Strong Buy) to 5 (Sell), offering investors a clearer picture of where experts believe the company is headed.
Analyzing Chubb's GF Value
Utilizing GuruFocus's proprietary metrics, the estimated GF Value for Chubb Ltd (CB, Financial) stands at $250.95 for the next year. This figure indicates a potential downside of 9.97% from the current market price of $278.73. The GF Value is meticulously calculated, factoring in historical trading multiples, past business growth, and forward-looking business performance projections. For those seeking an in-depth analysis, additional data can be accessed via the Chubb Ltd (CB) Summary page.