

- SAP shares experienced a 4% premarket decline after reporting second-quarter earnings.
- Analysts from Oppenheimer and Goldman Sachs highlight cloud growth and resilience.
- The stock's one-year price target suggests a potential upside of nearly 16%.
SAP's Strong Cloud Growth Amid Challenges
SAP (SAP, Financial) witnessed a 4% drop in its premarket shares following the release of its second-quarter earnings. Despite the dip, analysts have largely provided positive feedback. Oppenheimer maintained its Perform rating, emphasizing SAP's robust cloud growth and profitability. However, ongoing macroeconomic uncertainties and protracted transaction cycles remain areas of concern.
Goldman Sachs reinforced its Buy rating, pointing to SAP’s resilience and a noteworthy 28% expansion in its Current Cloud Backlog. Despite facing challenges in some sectors, SAP is confident in maintaining its 2025 guidance.
Wall Street Analysts' Forecast Insights
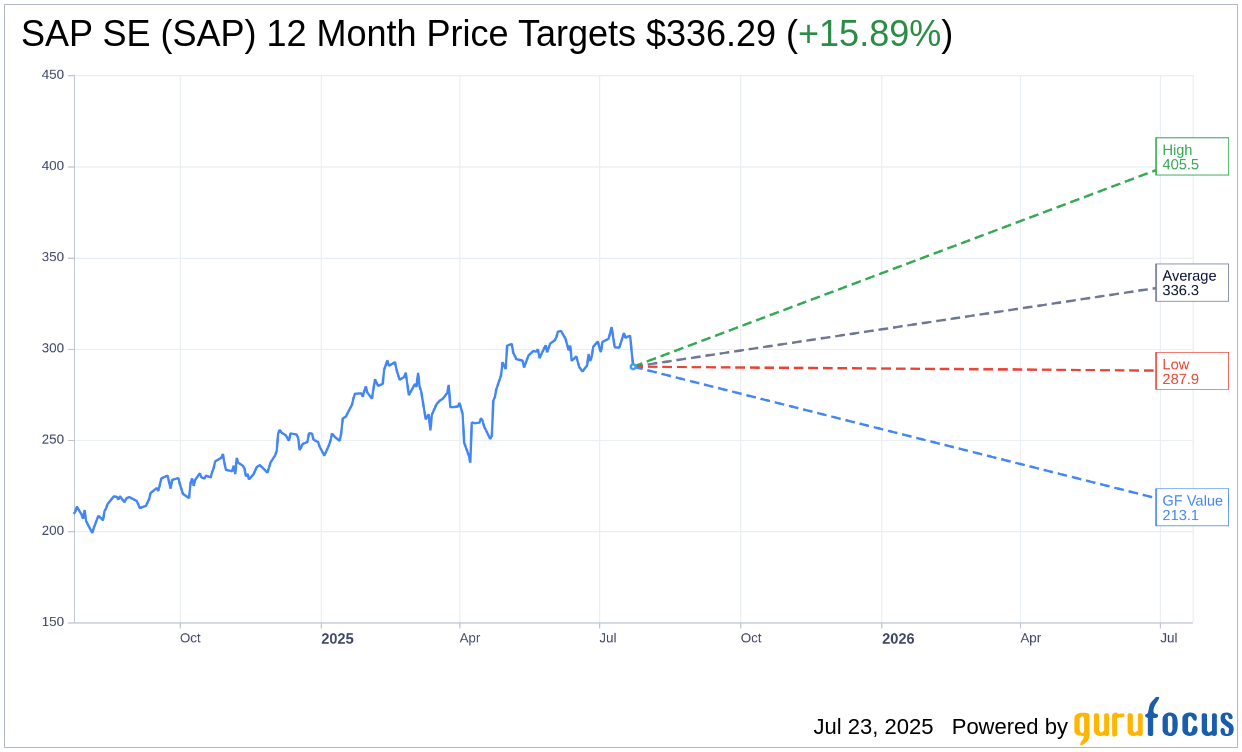
According to price target projections from 11 analysts, SAP SE (SAP, Financial) is estimated to reach an average price of $336.29 over the next year, with a high estimate of $405.46 and a low estimate of $287.90. This average target suggests a potential upside of 15.89% from its current price of $290.19. For further details, visit the SAP SE (SAP) Forecast page.
The consensus recommendation from 28 brokerage firms places SAP SE (SAP, Financial) at an average brokerage recommendation of 2.0, indicating an "Outperform" status. This rating is on a scale from 1 to 5, with 1 denoting Strong Buy and 5 indicating Sell.
Understanding SAP's Valuation
GuruFocus estimates suggest that the estimated GF Value for SAP SE (SAP, Financial) in one year is $213.10, indicating a potential downside of 26.57% from the current price of $290.19. The GF Value represents GuruFocus' fair value estimation for the stock, derived from historical trading multiples, past business growth, and future performance projections. More comprehensive data can be accessed on the SAP SE (SAP) Summary page.