
Blue-chip stocks continue to press higher as a broader trend in tech supports the overall market climate. “When we look at all of these trends, some significant factors become apparent: Both the S&P 500 and the Dow Jones Industrials have recovered all of the losses suffered during the 2008 financial crisis,” said Rick Bartlett of 4K Research. “But the same cannot be said for the tech-heavy NASDAQ, which is quickly approaching its highs from 1999.” In the opinion of most, previous technology rallies could be described as a “bubble,” given the massive depreciation in capital that quickly followed.
So the real question here is: Are we currently seeing another bubble in technology companies? There are some encouraging factors that support the argument that we are not currently in another technology bubble. One of these factors can be found in the recent popularity of cyber-security companies, which have seen massive increase in revenue after recent media stories highlighting email hacking.
Ultimately, this suggests that there are more real-world applications for technology companies -- and that the current environment does not represent a bubble. The best way to determine whether or not these trends are true is to look at the market performance of the tech heavyweights: Apple and Google. Here, we will assess trends in these companies, and round out the market analysis using financial and energy examples in Bank of America and Exxon Mobil.
________________________________
Apple, Inc. (NASDAQ: AAPL)
Critical Resistance:132
Critical Support: 120
Trading Bias: Bullish After Consolidation

(Chart Source: CornerTrader)
Apple, Inc. / AAPL Stock Trading Strategy: Latest rally has reached extreme levels, so buying in at current levels is unwise. Wait for pullbacks back into the 120 region before considering new long positions.
The positive trend in AAPL has reached new heights, with the latest highs coming in above 128. The move breaks a period of sideways consolidation, and the fact that the break came forcefully to the topside suggests that we are in for much more bullish activity in the coming months. But given the strength of the latest move, it would be unwise for traders to step in at current levels and start buying Apple stock. First, we will need to see a period of consolidation so that Apple can move back toward its historical averages. This would help to work off the overbought indicator readings in the MACD, and remove some of the risk involved when moving back into the long term uptrend. First level to watch is 120, which is an old resistance level that should now start to act as support.
_______________________________________
Google, Inc. (NASDAQ: GOOG)
Critical Resistance:560
Critical Support: 525
Trading Bias: Expecting Bullish Breakout
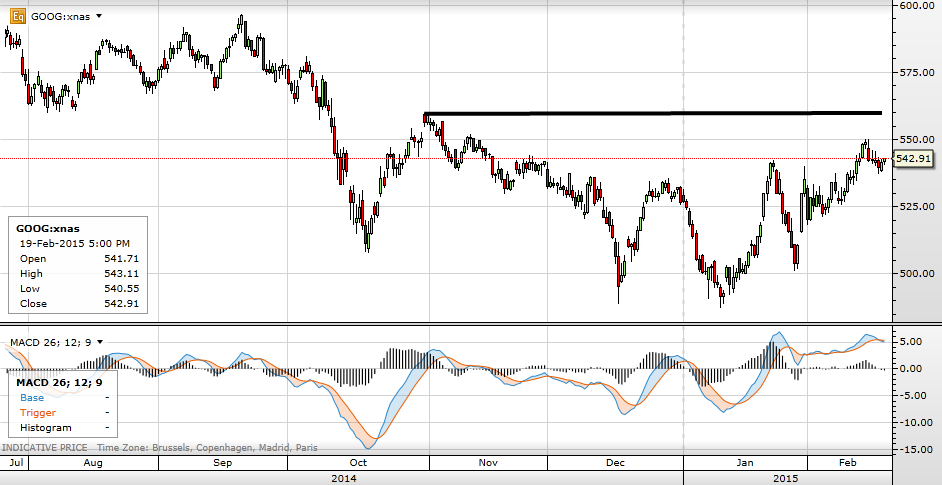
(Chart Source: CornerTrader)
Google, Inc. / GOOG Stock Trading Strategy: Google looks to be on the verge of a major bullish breakout if we overcome the 560 level. Establish buy positions here, or sell a failure.
Trend activity in GOOG is starting to look very encouraging now that we have convincingly overcome the psychological level at 500. The next major hurdle for Google can now be found at 560, which is the old resistance high from last October. Indicator readings are still bullish but we might need to wait for Google’s own period of consolidation before we can make another sustainable run higher. In either case, 560 is still the key price level, and if we see a clear break of 560 we will start to target prices near 600. Contrarian traders can take short term sell positions into 560 but stop losses should be kept very tight. A clear break of 560 suggests that Google’s bull run is still firmly in place.