
A) Introduction
Cigna Corporation (CI, Financial) is one of the largest health insurance companies in the United States, with a market cap near $34 billion. We think that Cigna presents a great opportunity for investors because of the company's strong growth profile, its reasonable valuation, its history of crushing analyst estimates, and the presence of potential near-term catalysts. Before we begin, investors should know that we tend to have a very quantitative style of analysis and only look at metrics that have been academically verified to predict stock returns. All of our analysis is from a comparables basis, as the majority of financial academic research has been done in this way. We will provide the links to the academic papers that we rely on as we analyze Cigna, or investors can get a summary of the papers here.
B) Valuation Analysis
We'll start with an analysis of Cigna's valuation, as valuation measures have the best historical track record of predicting stock returns (see here). Cigna's valuation profile is shown below:
(click to enlarge)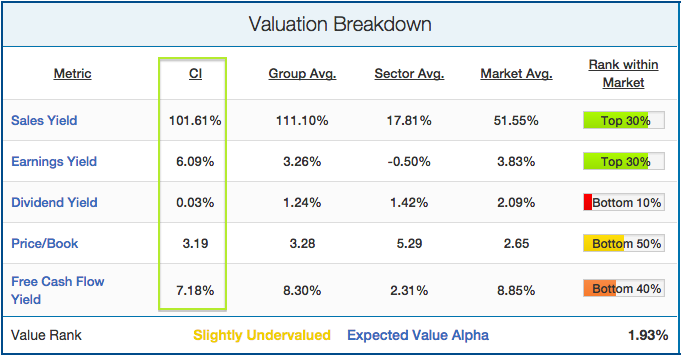 Source
Cigna's valuation looks attractive from a revenue and earnings perspective. Its sales (101.67%) and earnings (6.09%) yields are nearly double the market averages of 51.55% and 3.83%, respectively. While the company pays out a laughably small dividend, it returns capital to shareholders through share buybacks. Cigna's price to book multiple (3.2) and free cash flow yield (7.2%) both fall within the industry group averages. Overall, our value model rates Cigna as "slightly undervalued" relative to the market and ranks it in the 63rd percentile of all stocks from a valuation perspective. Our model expects stocks with that type of value profile to outperform the S&P 500 by about 2%, holding all else equal.
C) Growth Breakdown
Next, we'll look at Cigna's growth breakdown, specifically focusing on price momentum, EPS growth, and profitability efficiency. Price momentum is particularly important, as the momentum anomaly is almost as strong as the value anomaly (see here). EPS growth and profitability also have predictive power, though to a lesser degree, as initially outlined in James O'Shaughnessy's seminal book "What Works On Wall Street." Cigna's growth breakdown is shown below:
(click to enlarge)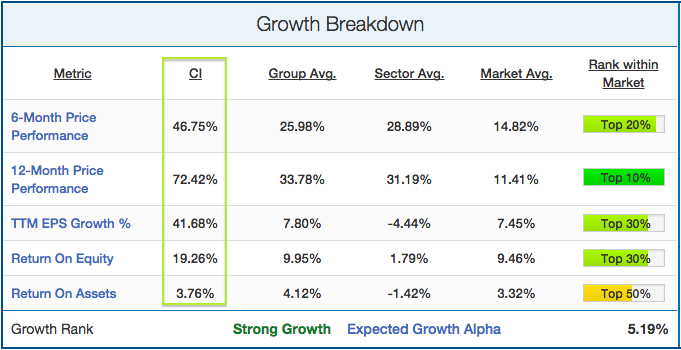 Source
The market has caught on to the opportunity in Cigna's stock, leading to an increase of 47% over the last six months and 72% over the last twelve. Contrary to public opinion, this is actually a great sign for future returns, especially with the reasonable valuation that we outlined earlier. Additionally, Cigna is growing earnings at a strong rate, with EPS increasing by 42% over the last twelve months. This is compared to an average increase of 7% in its industry group. Lastly, Cigna returns an impressive 19% on equity versus an average of 10% for its industry group. Overall, our growth model rates them as a "Strong Growth" stock and ranks it in the 94th percentile of all stocks from a growth perspective. Our model expects stocks with that type of valuation rank to outperform the S&P 500 by about 5.2%, holding all else equal.
D) Upcoming Earnings Breakdown
We also like to consider how a company's earnings have come out relative to analyst estimates recently, as we've found through historical testing that stocks that beat estimates are far more likely to continue beating them in the future. This is crucial as stocks see huge movements in their price depending on how earnings come out relative to expectations. Cigna's earnings track record is shown below:
(click to enlarge)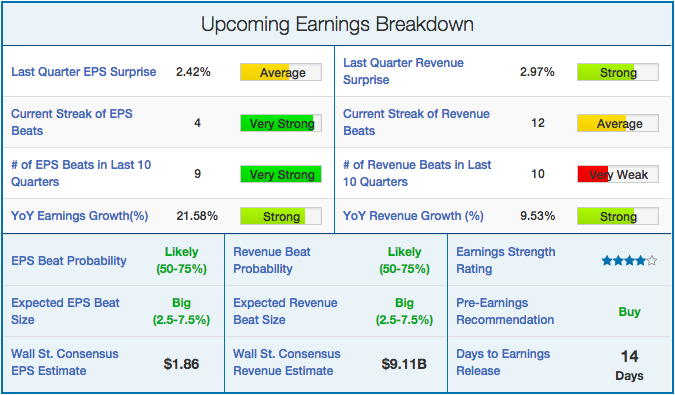 Source
Cigna beat last quarter EPS estimates by a small margin (2.42%), extending its streak of consecutive EPS beats to four and marking its 9th beat out of the last 10 quarters. Cigna has beaten revenue estimates 10 quarters in a row after last quarter's 3% beat on the revenue consensus number. Cigna grew last quarter EPS by 22% on a year-over-year basis, and revenue by 10%. This is key, as stocks with strong growth rates tend to beat analyst estimates at a high rate. Overall, our earnings model is very bullish on Cigna's earnings, recommending a 'buy' on the stock before release and projecting big beats on both the top and bottom-line. Cigna releases in 2 weeks, with analysts polled by Zacks' expecting EPS of $1.86 and revenue of $9.11 billion.
E) Conclusions
Now that we've broken down Cigna's valuation, growth, and earnings profile, we'll look at how the "smart money" is playing the stock. To do this, we'll analyze the short float, as historical testing has shown that high short interest tends to be inversely related to subsequent future returns (see here). Cigna's short interest relative to its industry group, sector, and market averages is shown below:

As we can see, short sellers have stayed away from Cigna's stock recently, with short interest making up just 1.11% of the float. This is in comparison to an average short float of 3.64% for its industry group and 5.55% for the average health care stock (seems investors are betting on a biotech & pharma bubble).
Another warning sign to worry about is the level of external financing the company has taken relative to the asset base. Academic studies have shown that a high level of external financing (debt & equity issuances) tends to lead to bad future returns, and vice versa. Cigna's level of external financing relative to the industry group, sector, and market averages is shown below:
As we can see, Cigna actually has a negative level of external financing relative to assets (-2%), which is due to the company's high level of share buybacks and limited use of debt. This is an outlier in a sector with an otherwise relatively heavy use of external financing (+3%).
Throw in the rumors of Cigna being a possible takeover target of Aetna (AET) and the recent price target raise from Oppenheimer, and it's clear that Cigna is firing on all cylinders. The box below highlights our concluding summary on the stock:
Our overall stock return projection model is extremely bullish on Cigna, and expects the stock price to outperform the S&P 500 by 9.59% over the next 12 months, putting it in the 92nd percentile of the +3000 U.S. equities we cover. In conclusion, we rate Cigna as a "Strong Outperform."