

The results are in.
2015 was a horrid year for the value strategies I publish at my value screener.
On a personal note, my overall performance across the four portfolios I manage ended the year +6.34%.
Thoughts on measuring performance
Not losing money is something that I’m pleased about because my focus is to protect the downside and to limit any damage so that I can live to invest another day.
My core goal is for long-term wealth creation – not market-relative performance or comparing results with others.
Beating the market is nice; if I was in the money managing business, I’m sure I’d be focusing on it, too. After all, that’s the nature of the game.
However, as a small investor, those are not the rules by which I want to play.
It’s a loser's game because, once you start comparing your results with someone else, it’s a vicious cycle of envy, lack of confidence and overtrying.
It just leads to further underperformance as you start to do things like:
- Increasing activity.
- Listening to herd behavior.
- Buying things you normally wouldn’t touch.
- Going for short-term gains to try and boost returns.
I had a couple of rough years where I just wanted to do better than anyone else. In the end I probably did the worst of anyone.
That’s why I’m pleased with how 2015 turned out because it shows that I’ve turned the page from the bad habits and years.
Or maybe I’m getting wiser?
At the start of 2015, I switched brokers to Interactive Brokers, and that took around 1½ months due to a lot of issues. That helped with a slow start (tradewise) to the year, and the trend of low activity continued throughout the year because I’m still finding it tedious to use the Interactive Brokers software to put in trades.
Another reason for ending with positive results is a result of active value investing. I made a conscious effort to constantly think about risk and portfolio management.
Usually, I just hold on to my position and only add if it drops. But this year, I’ve been on my toes monitoring my intrinsic value calculations and selling on strength and buying on weakness.
And it helped that I was able to reduce big positions and go to cash to soften the whiplash the market was going through around August and September.
While the market was dropping 6% to 7%, my portfolio dropped 2% to 3%. On the flipside, when the market was zooming back up, I was going up a little, but I’ll sacrifice the upside to protect the downside any day.
Definitely a change in mindset compared to a few years back when I was focused on beating the market on the upside.
That’s why the 2015 OSV Value Screener Results are very disappointing because they lost a lot of money.
All of them.
2015 OSV value strategy results

Except for the NCAV strategy, it was a bloodbath. But then again, the 2015 NCAV portfolio only had eight stocks, which I doubt anyone would follow in real life.
Here’s what the 2015 NCAV portfolio looked like.

You also wouldn’t be able to buy enough of the stock without moving it so that’s why, with the NCAV or NNWC screener, the results aren’t as good as they seem.
The strategy itself works, but if you are hoping to replicate the results, it will be much lower.
Thus, my current stance is to ignore the 2015 NCAV results and just consider that every strategy lost money in 2015.
Here’s a detailed look at the performance of each value strategy ending each quarter.
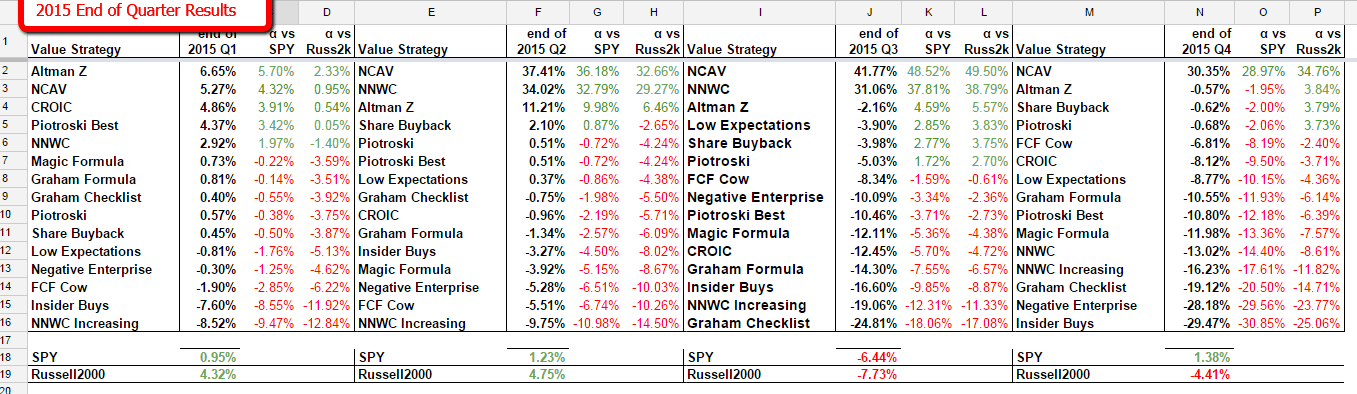
Results for 2015 (click to enlarge)
These are cumulative results at the end of each quarter and not quarterly results.
The year started out OK, but by the last quarter, everything got hit hard. I’ve seen this in my screens for awhile.
If value is out for a particular year, then everything across the board is hammered.
This is why I’m combining quality and growth along with value in the new QVG rating system that I’m developing. By combining all three and looking for the stocks that score the highest across all three, it won’t be subject to drastic falls like this.
Three-year, five-year, 10-year and 17-year results
The full table of results has been updated and is now live on the value screener page.
Here’s how it looks.

Full performance table (click to enlarge)
Three-year, five-year and 10-year CAGR numbers have been included to give more perspective.
I was disappointed with the performance since the inceptions of some strategies and wanted to see which ones need to be discontinued, replaced or adjusted.
For example, the “Piotroski Best” is a fan favorite, but with a 6.66% CAGR since inception, I was considering removing it. After seeing the three-, five- and 10-year performances, I concluded it’s too early to pull the plug.
The opposite of this is the negative enterprise screen. Sure it’s beating the market over a 17-year span, but for the past 10 years, it’s done a horrific job.
There are five screens like this that are now on the chopping block.
- NNWC increasing – created to find turnaround stocks using signs from the balance sheet.
- Insider buys – designed to go after stocks with high ownership and high insider buys.
- Graham checklist – an adjusted version based on an old Graham paper of what he looked for in a stock.
- Low expectations – the idea was that stocks with low expectations don’t go down as much.
- Negative enterprise – cash box companies for explosive returns.
Ideas for new stock screens?
With five potentially new screens to create, what are some screeners you want to see?
Leave a comment with an idea that you have or a paper that you’ve read.
The more detailed with reasoning the better as it will help to formulate a thesis and to test it.
With 2016 under way, I’ll be posting a mega list of 2016 value stocks for you to download as well as sharing some behind-the-scenes stuff at old school value and what’s to come.