

I am always looking for ways to become more productive and efficient.
One frustrating task is keeping a big list of stocks, monitoring their prices in real time and being able to reference the stocks’ underlying fundamentals. Here are some hacks using Google sheets. I will create a Google spreadsheet that merges fundamental company data with recent stock price data and then show how to link each line item with the most recent news headline for each company.
The benefits of the Google hacks include:
- Pulling recent stock quotes into Google sheets.
- Pulling table data from webpages.
- Merging recent stock quotes with fundamental stock data so you can use spreadsheet functionalities like sorting, filtering, performing complex calculations, conditional formatting, pivot tables, charts, etc.
- Creating customized views with current stock price data and news headlines.
- Creating customized views for desktop and mobile devices while excluding annoying ads.
Case Study 1: Download from GuruFocus screener
Objective: Link recent stock prices with fundamental data in a single tabular view.
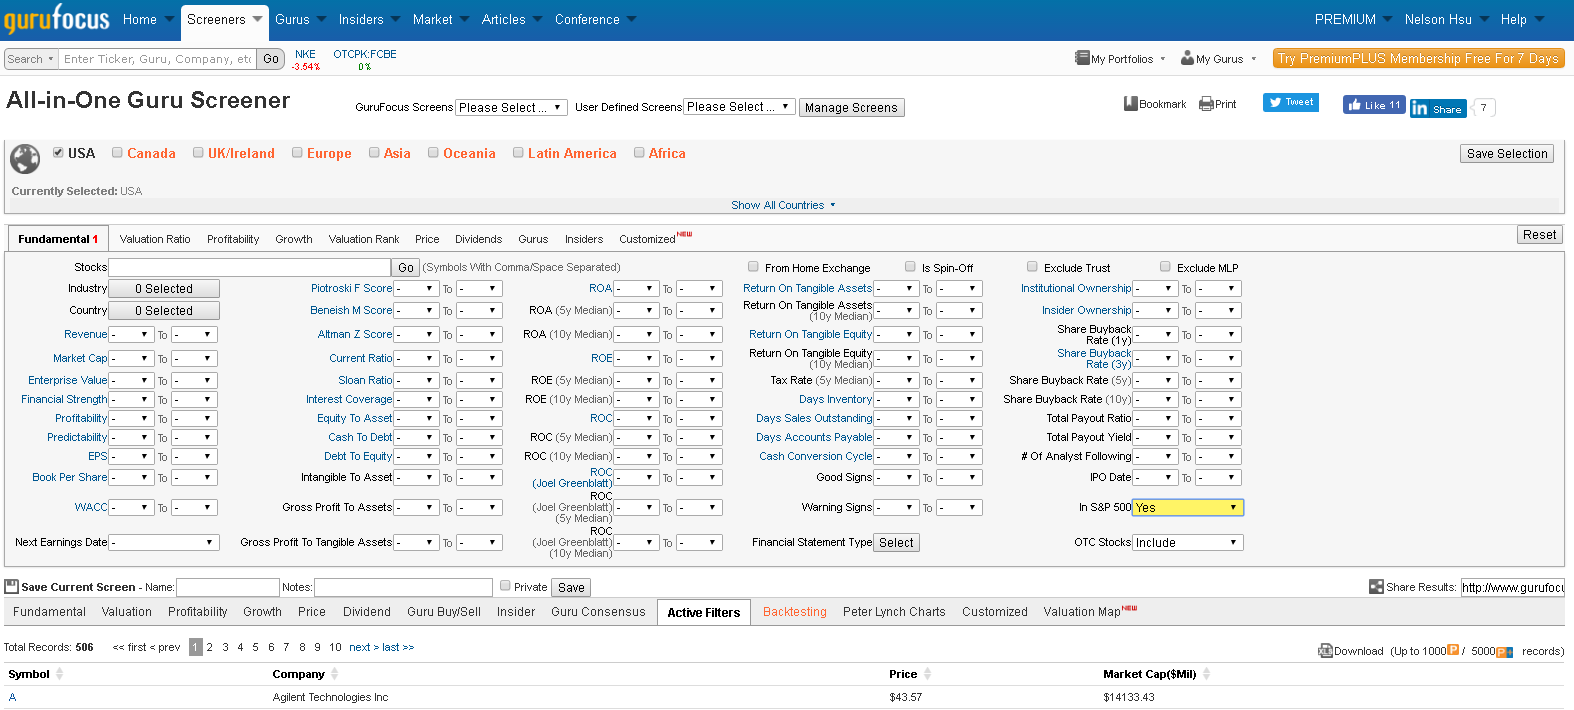
Step 1: Use the GuruFocus All-in-One Screener and filter the desired stocks. In this case, download the entire list of Standard & Poor's 500 stocks. From looking at the screenshot below, you can see the “In S&P” parameter has been set to “Yes” and everything else is left alone.
Step 2: Download the .CSV file to the computer. The “download” icon is in the bottom right hand corner.
Step 3: Open the .CSV file that was just downloaded. In this case, the filename should look something like “GuruFocus_download_2016-10-31-14-54”.
Step 4: Highlight all of the text from the .CSV file and Copy.
Step 5: In the web browser (i.e., Google Chrome), open a Google Sheet.
Step 6: Paste the data from the .CSV file into the Google Sheet. The Google Sheet should now look like the screenshot below.
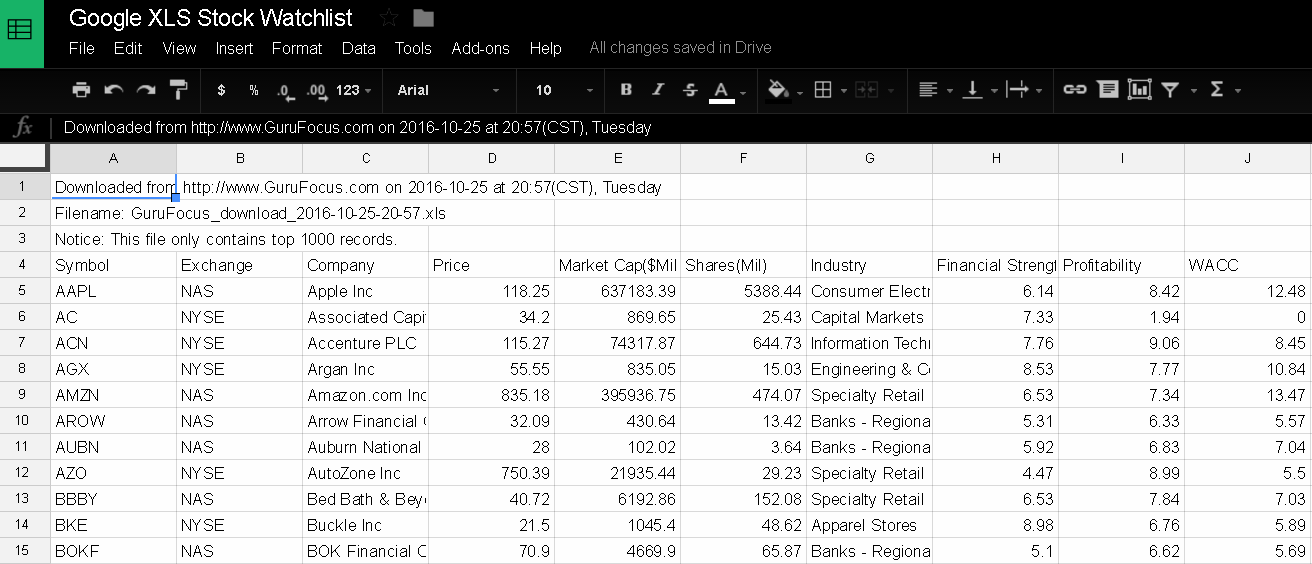
Data can be retrieved from any source as long as it has the ticker symbols, but I like GuruFocus because it has a lot of data. From this download, there are 127 columns of data. All of the column headings are listed below. Basically, I want to see all of that data in one quick view with the stock prices updated in a timely manner. I also want it in a spreadsheet so I can manipulate the data quickly.
| Symbol | Debt To Revenue Growth Rate 1 Year | Gross Margin |
| Exchange | Debt To Revenue Growth Rate 5 Year | Net Margin |
| Company | Debt To Revenue Growth Rate 10 Year | Pretax Margin |
| Price | Asset Growth Rate 1 Year | Shiller PE |
| Market Cap($Mil) | Asset Growth Rate 5 Year | EV/EBIT |
| Shares(Mil) | Asset Growth Rate 10 Year | EV/EBITDA |
| Industry | Dividend Growth Rate | EV/Sales |
| Financial Strength | Yield | Institutional Ownership |
| Profitability | Yield On Cost | Insider Ownership |
| WACC | PayoutRatio | Price to Tangible Book |
| Predictability | ROE | Warning Signs |
| Revenue ($Mil) | ROA | Good Signs |
| Enterprise Value ($Mil) | ROI | Share Buyback Rate (10y) |
| Volume | ROC | Share Buyback Rate (5y) |
| Short Ratio | ROC (Joel Greenblatt (Trades, Portfolio)) | Share Buyback Rate (3y) |
| Short % of Float | ROTE | Share Buyback Rate (1y) |
| Price Today's Change | ROTA | Earnings Yield (Greenblatt) |
| Price Change (1 week) | ROE (10y median) | Forward Rate of Return (Yacktman) |
| Price Change (4 weeks) | ROA (10y median) | P/FCF |
| Price Change (12 weeks) | ROC (Joel Greenblatt (Trades, Portfolio)) (10y median) | P/E |
| Price Change (24 weeks) | ROE (5y median) | P/E (NRI) |
| Price Change (52 weeks) | ROA (5y median) | P/S |
| Price Change (3-Y Annualized) | ROC (Joel Greenblatt (Trades, Portfolio)) (5y median) | % Above historical Low PS |
| Price Change (5-Y Annualized) | ROC (10y median) | % Below historical High PS |
| Price Change (10-Y Annualized) | ROC (5y median) | P/B |
| Price Change rel S&P (1 week) | Tax Rate (5y median) | % Above historical Low PB |
| Price Change rel S&P (4 weeks) | Operating Margin (5y median) | % Below historical High PB |
| Price Change rel S&P (12 weeks) | Cash to Debt | NCAV |
| Price Change rel S&P (24 weeks) | Equity to Asset | Net Cash |
| Price Change rel S&P (52 weeks) | Interest Coverage | % Above 52 Week Low |
| Price Change YTD | Sloan Ratio | % Below 52 Week High |
| Price Change Rel S&P500 (YTD) | EPS | Median PS |
| Revenue Growth Rate 1 Year | Beta | Peter Lynch Fair Value |
| Revenue Growth Rate 5 Year | Book/shr | Graham Number |
| Revenue Growth Rate 10 Year | Debt/Equity | PEG |
| EBITDA Growth Rate 1 Year | Current Ratio | DCF (FCF Based) Value |
| EBITDA Growth Rate 5 Year | Quick Ratio | DCF (FCF Based) P/Value |
| EBITDA Growth Rate 10 Year | F Score | DCF (Earnings Based) Value |
| EPS Growth Rate 1 Year | Z Score | DCF (Earnings Based) P/Value |
| EPS Growth Rate 5 Year | M Score | Projected FCF Value |
| EPS Growth Rate 10 Year | Operating Margin | Projected FCF P/Value |
| Book Growth Rate 1 Year | Â | Next Earnings Date |
| Book Growth Rate 5 Year | Â | Â |
| Book Growth Rate 10 Year | Â | Â |
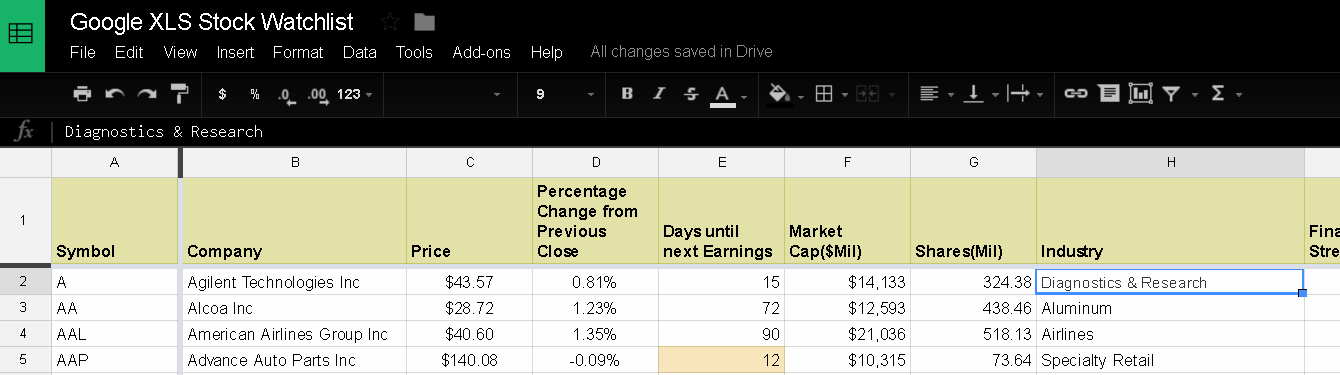
Step 7: In the screenshot below, I have made some adjustments. I did not find column B (the “stock exchange” column) useful, so I completely removed it. I have also completely removed rows 1, 2 and 3. I kept the “Price” column but deleted all of the data in that column and added two more columns, “Percent Change from Previous Close” and “Days Until Next Earnings."
Step 8: Here is where Google sheet functionality comes in. To get updated stock prices, enter the formula “=GOOGLEFINANCE($A2,"price")” into cell C2. To get “Percent Change from Previous Close," enter the formula “=GOOGLEFINANCE($A2,"changepct")/100” into cell D2. To get “Days until next earnings,” enter the formula “=abs(DX2-today())” into cell E2. This is assuming the column DX is the “next earnings date” column. If not, change the formula to reflect the correct column for “next earnings date.” Copy data from cells C2, D2 and E2 and drag them all the way down to the last line item.
Now all of the S&P 500 stocks with timely price information and the 128 columns of supporting data are organized. The data can be manipulated to fit the user's needs. For example, I added conditional formatting to highlight stocks where the earnings date is less than 14 days away. To see which stocks are tanking, sort Column D, “Percent Change from Previous Close,” in ascending order. The information can also be used to create pivot tables, charts, etc.
To refresh the Google stock data, hit the “F5” button.
Case Study 2: Retrieve news for individual stocks
Objective: Use the IMPORTHTML function to retrieve recent news for individual stocks from the finviz.com web page.
The IMPORTHTML function in Google Sheets lets you retrieve lists and tables from within web pages. Say you want to see Nike (NKE, Financial) and Under Armour (UA, Financial) news side by side on the same sheet.
Step 8: Create another sheet in the same file.
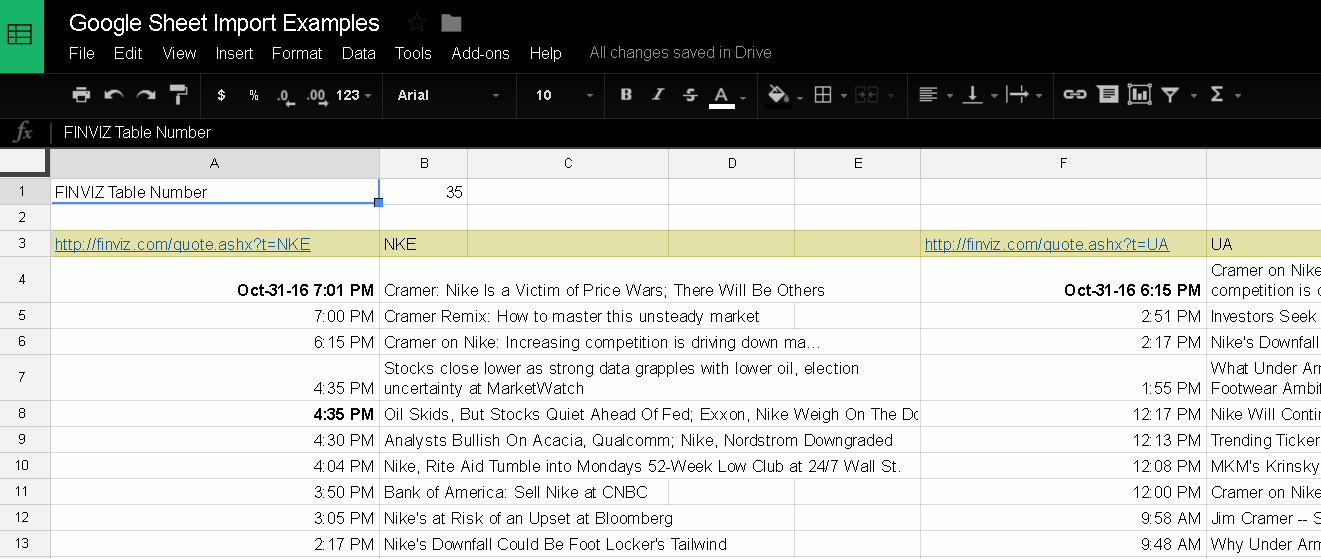
Step 9: In cell A1, type “FINVIZ Table Number” and in cell B1, type “35.”
Step 10: In cell A3, type (or copy and paste) “="http://finviz.com/quote.ashx?t="&B3” and in cell F3, type “="http://finviz.com/quote.ashx?t="&G3”.
Step 11: In cell B3, type “NKE” and in cell G3, type “UA.”
Step 12: In cell A4, type “=IMPORTHTML(A3,"table",$B$1)” and in cell F4, type “=IMPORTHTML(F3,"table",$B$1).”
It will take the spreadsheet a moment to load, but you should get the results displayed in the screenshot above. The IMPORTHTML requires three parameters. The first parameter is the URL of the page the data is being pulled from. In this case, the data from a finviz.com page. The URL string begins with “http://finviz.com/quote.ashx?t=”. The last part of the URL requires the ticker symbol of the stock to be looked up. In this case, the ticker symbols of Nike and Under Armour are NKE and UA. Enter the ticker symbol into cells B3 and G3 and it should retrieve the company specific news from finviz.
The second IMPORTHTML parameter is either “list” or “table”. We are pulling tables from the target web page, so we use the value “table”. The third IMPORTHTML parameter is the number of the table within the web page. Table 35 on the finviz URL contains the newsfeed.
Play around with cell B1 to see which other tables are within the finviz URL. Another way to get table number is “view source code” on the webpage and count the different tables. For this study, the formula “=IMPORTHTML(A3,"table",$B$1)” should appear in cell A4.
Case Study 3: Link data from Case Study 1 with data from Case Study 2
Objective: Link most recent Nike headline with the first sheet.
Step 13: Go back to the sheet with the S&P 500 data.
Step 14: Find the row with Nike’s data.
Step 15: Click on the first empty cell on the Nike row and then enter formula “=Sheet2!B4”. This is assuming the second sheet is named “Sheet 2”. If not, change the parameter to reflect the appropriate name of the sheet with the Nike news.
This is how to link the row with Nike’s company data with the most recent Nike headline. In the screenshot above, the most recent Nike headline is “Cramer: Nike Is a Victim of Price Wars; There Will Be Others,” which is in cell B4 of Sheet 2.
I do not suggest linking news to 500 rows. That would immensely slow down your file.
Imagine the possibilities now that you are aware of how to retrieve data from websites. For example, investors could build a revenue model for an oil company and link to another sheet that has a table with updated commodity prices. Or say an investor is looking at the airline industry. They could grab PRASM (Passenger Revenue per Available Seat Mile) data and link to the airline stocks.
These are some methods I stumbled upon to organize data. I would be interested to hear useful hacks from readers or other ways readers pull together data from various sources. I have not figured out how to use the IMPORTXML function. Specifically, I would like to retrieve data from the GuruFocus “15-Y Financials" tab. If anyone has figured that out, please comment below.
Start a free 7-day trial of Premium Membership to GuruFocus.