

I’ve written a lot about how the U.S. dollar is the fulcrum of the global financial system.
Commodities are priced in dollars. Global trade is done in dollars. And the majority of international funding is in USD.
The dollar is important. Dollar trends impact markets and assets around the world in various ways. Hence, the dollar is the fulcrum.
But if the dollar is the fulcrum, then gold is the foundation on which that fulcrum sits.

I should make clear, I’m no gold bug and have no special affinity for the yellow metal.
But when it comes to analyzing assets and markets, we run into a measurement problem. That measurement problem is due to the fact that things that are priced in U.S. dollars, or any currency, fluctuate according to the price of the currency in addition to the goods' underlying supply and demand fundamentals (i.e., the price of oil is impacted by the relative price of a U.S. dollar).
And the price of dollars can fluctuate a lot.
You can see how this makes things difficult. When you analyze goods priced in USD you have to also assess the U.S. dollar as well.
Gold is a useful tool in helping with this measurement issue.
Perhaps due to gold’s long history as a store of value, it has a special place in the market’s psyche. Since gold is priced in USD but has little intrinsic value (i.e., little productive use and no cash flows), it acts as a good barometer to gauge the changing relative value of $1 USD of account or the price of 1 unit of USD liquidity (USD assets).
When international demand for USD liquidity exceeds supply, gold tends to perform poorly. And vice versa when USD liquidity exceeds global demand for that USD liquidity.
Make sense?
Because of this, when I’m trying to discern the probabilities of where the dollar is headed next, I always start with gold. Even though gold is priced in dollars, it often leads at major turning points because the fundamentals are similar for both assets. But for whatever reason those fundamentals often show themselves in gold first.
Of course, this isn’t always the case (there’s no such thing as a perfect indicator). But even in the cases when it doesn’t lead it still serves as a good confirming or disconfirming signal for the dollar.
Below are some charts. They’re a little messy, but I think they get my point across and show how useful gold can be as a leading and/or confirming signal for the dollar and hence the dollar-priced commodities.

This chart shows gold inverted (black bars) and the U.S. dollar (red line) on a monthly basis.
Notice how gold failed to confirm the dollar’s bear move from 1994-96 when the dollar sold off but gold traded sideways in a range. This is a disconfirming signal for the dollar which suggested the move was a corrective one and not the start of a new trend.
But then, in 1996, both the dollar and gold (inverted) began trending upwards together. This signaled that this was the start of a new trend. The macro fundamentals also supported the case. The world was hungry for U.S. dollar liquidity (assets), and demand outstripped supply, which was bearish for gold but bullish for the dollar.
Then go to 2001 where inverted gold peaked and began making lower lows and lower highs -- while at the same time, the dollar made one more new high. Gold gave a leading signal that the bull market in the dollar was over.
Now check out this chart.

Here’s the current dollar bull market (red line) on the weekly. The dollar made lower new highs and coiled into a tight range from 2013-14. At the same time, inverted gold trended higher, not confirming the lower move in the dollar which suggested building pressure in USD demand.
Then again, from 2016-2017, inverted gold moved lower while the dollar made a new cycle high that gold did not confirm. This gave a sell signal on the dollar and USD shortly turned over thereafter.
Of course, there are instances where the indicator gives false signals, and using it is as much an art as it is a science. It alone shouldn’t be used as a reason to go long or short the dollar but rather as a key input into one’s macro decision making process.
Now let’s quickly look at where gold and hence the dollar may be headed in the near future. Many of the charts are suggesting a coming explosive move in one direction or another.
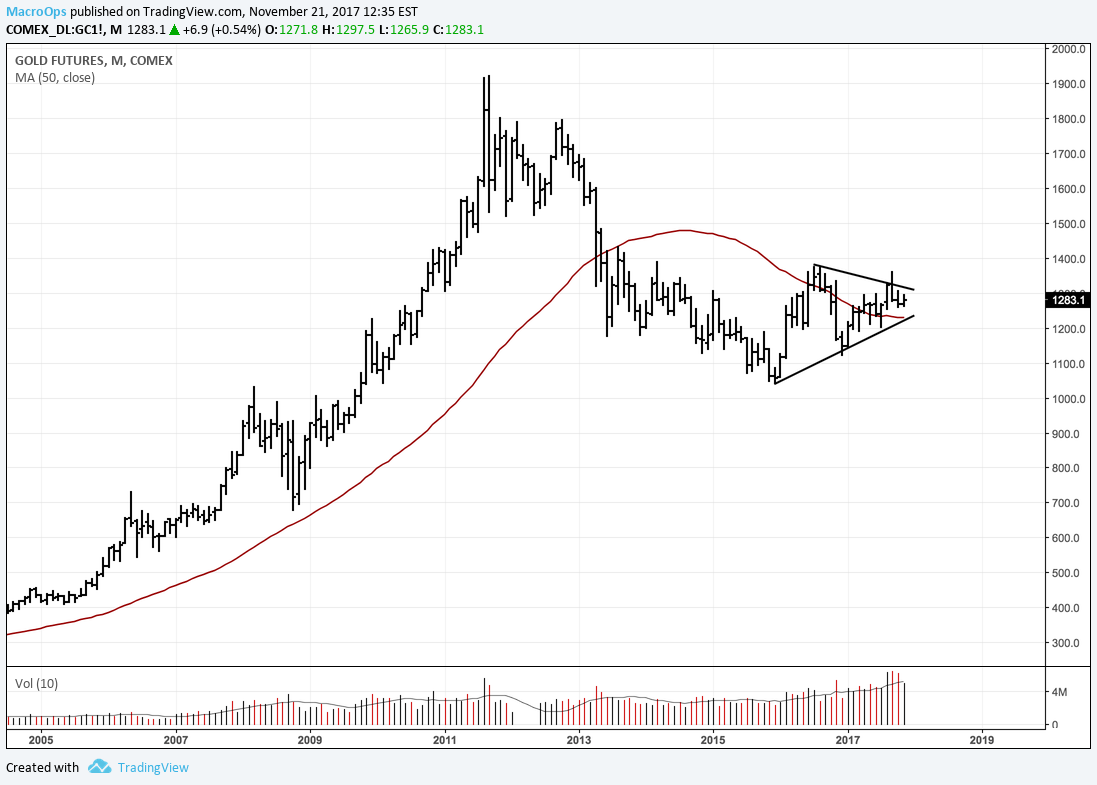
Below is gold on the monthly timeframe showing a coiling pattern. This type of price action typically precedes large moves.
And I’ve been pointing out over the last month how numerous dollar pairs are at large critical junctures and a coming significant move is likely.
Below are AUDUSD, GBPUSD and EURUSD on a monthly basis.


Now let’s take a closer look at gold and see if it’s telling us anything.
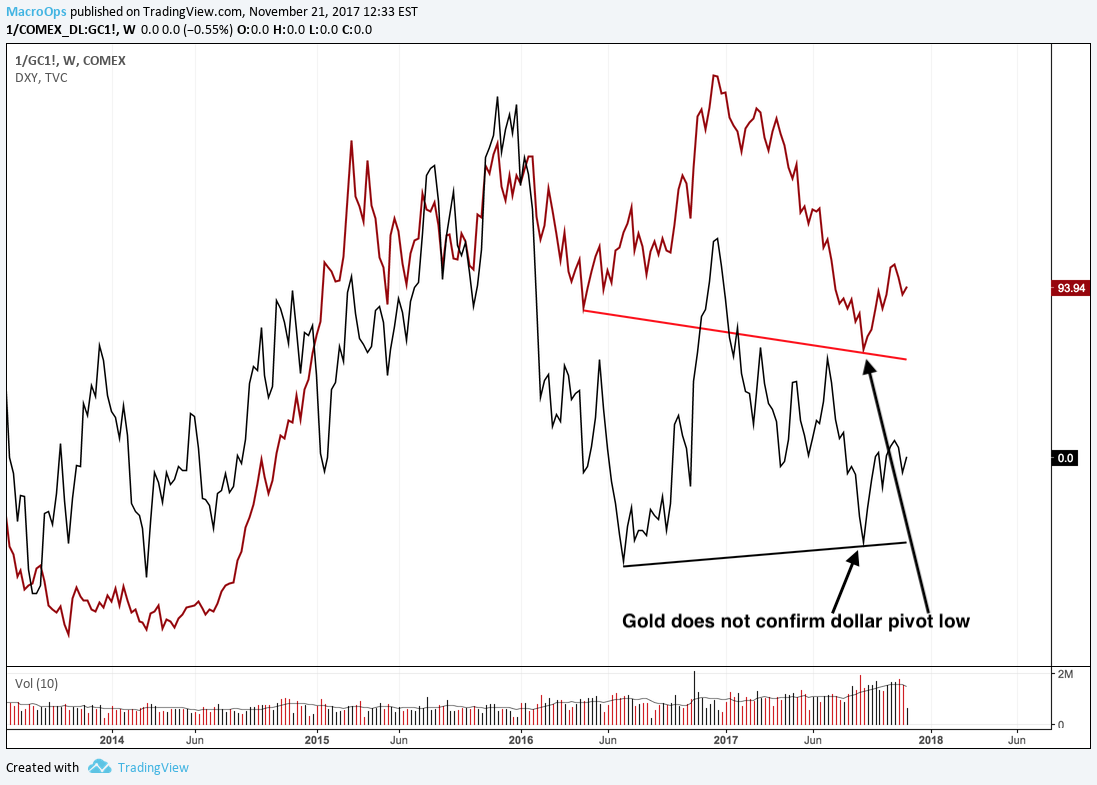
In this chart, gold (inverted) and marked by the black line failed to confirm the dollar's most recent new pivot low. But the disparity isn’t that great, so this doesn’t give us much confidence.
Another thing I like to do is to look at the momentum structure of gold to see if momentum is building in one direction or another.
The chart below shows gold (black line) and gold’s momentum relative to its three-year mean. It signalled the end of the bull market in gold well beforehand. But right now, it’s not tipping the scales in one direction or another. It’s slightly positive to neutral.

Unfortunately, it’s tough to get a good read at the moment. My bias is that U.S. stocks are about to start outperforming the rest of the world soon. This is going to help reverse capital flows, which will put a bid back under the dollar and start a new leg higher in the greenback.
There are other macro dynamics such as changing international trade rules, raising the debt ceiling and passing U.S. tax and monetary policy which are supportive of this hypothesis.
I believe that gold is setting up to signal one way or another soon, so I’ll be keeping a close eye on it.
In a future piece I’ll lay out a fundamental macro model I use that shows one way of looking at the big picture USD liquidity supply and demand picture. This is a useful tool for seeing where the attractors are for gold on a cyclic level.
 If you’d like more of this type of research, check out the Macro Intelligence Report (MIR) here.