
I’m setting up a new experiment for 2009/2010 along the same lines as the 2008/2009 Net Net vs Activist Legend thought experiment pitting a little Graham net net against activist investing legend Carl Icahn (Net Net vs Activist Legend: And the winner is…). This time around I’m pitting a small portfolio of near Graham net nets against a small portfolio of ultra-low price-to-book value stocks. The reason? Near Graham net nets are stocks trading at a small premium to Graham’s two-thirds NCAV cut-off, but still trading at a discount to NCAV. While they are also obviously trading at a discount to book, they will in many cases trade at a higher price-to-book value ratio than a portfolio of stocks selected on the basis of price-to-book only. I’m interested to see which will perform better in 2010. The two portfolios are set out below (each contains 30 stocks). I’ll track the equal-weighted returns of each through the year.
The Near Graham Net Net Portfolio:
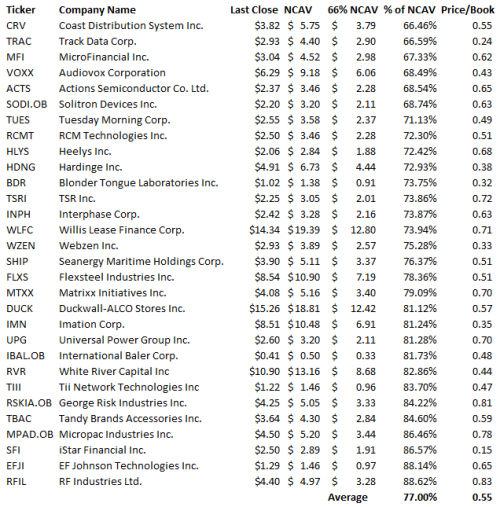
The Ultra-low Price-to-book Portfolio:
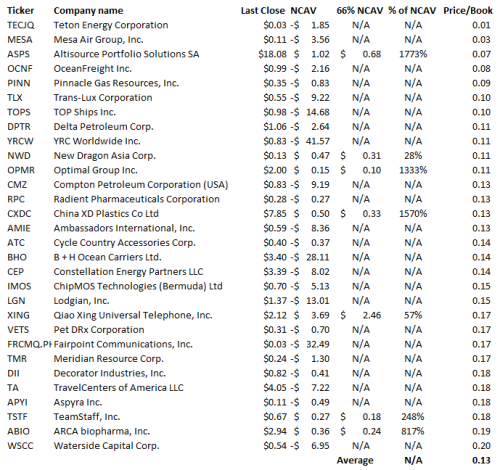
The Ultra-low Price-to-book Portfolio contains a sickly lot from a net current asset value perspective. Most have a negative net current asset value, as their liabilities exceed their current assets. Where that occurs, the proportion of price to NCAV is meaningless, so I’ve just recorded it as “N/A”. The few stocks that do have a positive net current asset value are generally trading a substantial premium to that value, with the exception of NWD and ZING, which qualify as Graham net nets.
While the Net Net vs Activist Legend thought experiment didn’t amount to (ahem) a formal academic study, there are two studies relevant to the outcome in that experiment: Professor Henry Oppenheimer’s Ben Graham’s Net Current Asset Values: A Performance Update, which found “[the] mean return from net current asset stocks for the 13-year period [from 1970 to 1983] was 29.4% per year versus 11.5% per year for the NYSE-AMEX Index.” Also relevant was Hedge Fund Activism, Corporate Governance, and Firm Performance, by Brav, Jiang, Thomas and Partnoy, in which the authors found that the “market reacts favorably to hedge fund activism, as the abnormal return upon announcement of potential activism is in the range of [7%] seven percent, with no return reversal during the subsequent year.”
This experiment is similar to the Net Net vs Activist Legend thought experiment in that it isn’t statistically significant. There are, however, several studies relevant to divining the outcome. In this instance, Professor Oppenheimer’s study speaks to the return on the Near Graham Net Net Portfolio, as Roger Ibbotson’s Decile Portfolios of the New York Stock Exchange, 1967 – 1984(1986), Werner F.M. DeBondt and Richard H. Thaler’s Further Evidence on Investor Overreaction and Stock Market Seasonality (1987), Josef Lakonishok, Andrei Shleifer, and Robert Vishny’s Contrarian Investment, Extrapolation and Risk (1994) as updated by The Brandes Institute’s Value vs Glamour: A Global Phenomenon (2008) speak to the return on the Ultra-low Price-to-book Portfolio. One wrinkle in that theory is that the low price-to-book value studies only examine the cheapest quintile and decile, where I have taken the cheapest 30 stocks on the Google Finance screener, which is the cheapest decile of the cheapest decile. I expect these stocks to do better than the low price-to-book studies would suggest. That said, I expect that the Near Graham Net Net Portfolio will outperform the Ultra-low Price-to-book Portfolio by a small margin. Let me know which horse you’re getting on and the reason in the comments.
[Full Disclosure: I hold RCMT and TSRI. This is neither a recommendation to buy or sell any securities. All information provided believed to be reliable and presented for information purposes only. Do your own research before investing in any security.]
Greenbackd
http://greenbackd.com/
Also check out:
The Near Graham Net Net Portfolio:
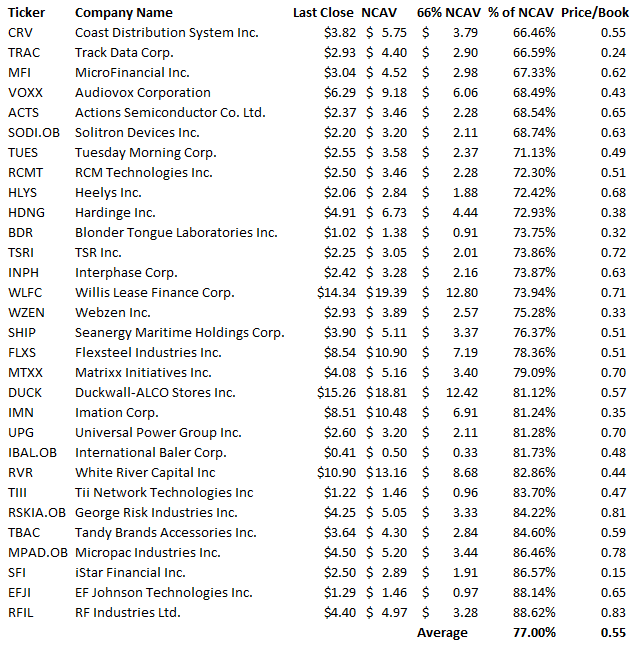
The Ultra-low Price-to-book Portfolio:

The Ultra-low Price-to-book Portfolio contains a sickly lot from a net current asset value perspective. Most have a negative net current asset value, as their liabilities exceed their current assets. Where that occurs, the proportion of price to NCAV is meaningless, so I’ve just recorded it as “N/A”. The few stocks that do have a positive net current asset value are generally trading a substantial premium to that value, with the exception of NWD and ZING, which qualify as Graham net nets.
While the Net Net vs Activist Legend thought experiment didn’t amount to (ahem) a formal academic study, there are two studies relevant to the outcome in that experiment: Professor Henry Oppenheimer’s Ben Graham’s Net Current Asset Values: A Performance Update, which found “[the] mean return from net current asset stocks for the 13-year period [from 1970 to 1983] was 29.4% per year versus 11.5% per year for the NYSE-AMEX Index.” Also relevant was Hedge Fund Activism, Corporate Governance, and Firm Performance, by Brav, Jiang, Thomas and Partnoy, in which the authors found that the “market reacts favorably to hedge fund activism, as the abnormal return upon announcement of potential activism is in the range of [7%] seven percent, with no return reversal during the subsequent year.”
This experiment is similar to the Net Net vs Activist Legend thought experiment in that it isn’t statistically significant. There are, however, several studies relevant to divining the outcome. In this instance, Professor Oppenheimer’s study speaks to the return on the Near Graham Net Net Portfolio, as Roger Ibbotson’s Decile Portfolios of the New York Stock Exchange, 1967 – 1984(1986), Werner F.M. DeBondt and Richard H. Thaler’s Further Evidence on Investor Overreaction and Stock Market Seasonality (1987), Josef Lakonishok, Andrei Shleifer, and Robert Vishny’s Contrarian Investment, Extrapolation and Risk (1994) as updated by The Brandes Institute’s Value vs Glamour: A Global Phenomenon (2008) speak to the return on the Ultra-low Price-to-book Portfolio. One wrinkle in that theory is that the low price-to-book value studies only examine the cheapest quintile and decile, where I have taken the cheapest 30 stocks on the Google Finance screener, which is the cheapest decile of the cheapest decile. I expect these stocks to do better than the low price-to-book studies would suggest. That said, I expect that the Near Graham Net Net Portfolio will outperform the Ultra-low Price-to-book Portfolio by a small margin. Let me know which horse you’re getting on and the reason in the comments.
[Full Disclosure: I hold RCMT and TSRI. This is neither a recommendation to buy or sell any securities. All information provided believed to be reliable and presented for information purposes only. Do your own research before investing in any security.]
Greenbackd
http://greenbackd.com/
Also check out: