
One of my favorite topics when it comes to the stock market is how to value a stock. I always felt there was something mysterious about pricing a stock, and if understood well will lead to winning investment ideas. Well, we are in the business of finding winners. The key to valuing a stock is understanding the basics of the various methods to price stocks. So today I want to dig into one of the very first valuation metrics I learned: The Revenue Multiple. The great thing about the revenue multiple is its simplicity. On the other hand, it could also lead to poor valuation work. Before we jump the gun here, lets define what a revenue multiple is.
There are two basic revenue multiples that every investor needs to be made aware of. The first, and most popular, is Price to Sales or simply P/S. The second, and the more robust metric of the two, is the Enterprise Value (Equity + Debt - Cash) to Sales or EV/S.
Price to Sales Ratio = Market Value of Equity/Revenue
Enterprise Value to Sales Ratio = (Market Value of Equity + Debt – Cash)/Revenue
The EV/S multiple is more robust than the P/S multiple because it is more accurate to look at a company’s total capital structure rather than just its equity portion. For a more detailed discussion of this please click on the following link: EBITDA: The Holy Grail of Stock Valuation
Ok, let’s look at how the P/S and EV/S can lead to different valuation outcomes. We will look at a firm with a lot of debt: Duke Energy (DUK).
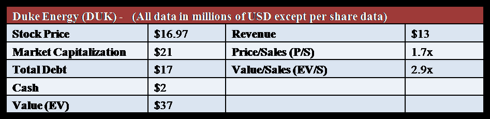
In this example since DUK is highly levered, it leads to a lower value for the equity portion (equity is what the holders of the stock get).
When you look at a company with minimal debt like Electronic Arts (ERTS), you see a profound difference.
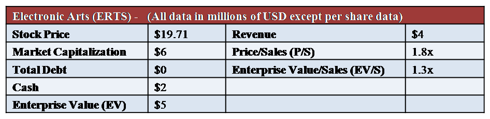
The difference is quite large and can lead to different valuation outcomes. Take your time and closely study the P/S and EV/S multiples. The driver is the debt. Duke (DUK) had quite a bit of debt. On the other side of spectrum, Electronic Arts (ERTS) carries zero debt. When you look at the P/S and EV/S you can see how debt affected the pricing of the equity. So what else is this telling us? Well if you look at the P/S ratio of Electronic Arts, it is telling us that investors are willing to pay $1.80 (rounded) for every $1 of revenue that ERTS generates. Is that a reasonable multiple to pay? It depends. This is when you need to put on your analysis cap and do some historical analysis to get a good grasp on whether the multiple today is truly a value multiple.
Pros
Unlike earnings and book value multiples, which can become negative for many companies, the revenue multiple is available for most firms. This includes startup and distressed companies. Another strength of the revenue multiple is being less susceptible to accounting tricks. Accounting plays a big role in determining net income and book value, and these values are influenced by accounting decisions on depreciation, inventory, R&D, acquisition accounting and extraordinary charges. Furthermore, revenue multiples are less volatile than earnings multiples and hence are less likely to be affected by year-to-year swings in a firm’s fortune. For instance, the price-earnings ratio (P/E) of a cyclical firm changes much more than its price-sales ratios (P/S), because earnings are much more sensitive to economic changes than revenues.
Cons
The biggest disadvantage of focusing on revenue is that it can lull you into assigning tremendous amounts of value to firms that are generating high revenue growth while actually losing significant amounts of money. Ultimately, a firm has to generate earnings and cash flows for it to have value. The revenue multiple fails in this regard quite miserably.
Overall, we at CR Investor don’t depend too heavily on the revenue multiple because our focus is on free cash flow, because this is what the shareholders are entitled to. However, the revenue multiple is an insightful data point that should be looked at and considered in the overall analysis and valuation. Furthermore, when using any type of market multiple please compare apples to apples. This means compares market multiples such as the revenue multiple to companies that are in the same line of business.
If you want to learn more about valuation please visit CRInvestor.net.
Happy Investing,Alexis Evidente
[email protected]
www.CRInvestor.net
Facebook: ClearResearch
Twitter: CR_Investor
If you really want to see our investment process in action please go to our site CRInvestor.net. You will find unbelievable research and reports that captures the true essence of value investing and education. We show our members how to become better stock pickers by sharpening their valuation skills. Our reports provide institutional level research never seen before on the retail level. We found Joe’s Jeans (JOEZ) at $0.22 which yielded an 845% return, and Hi-Shear Technology (HSR) that returned over 199% before being bought out. Not to mention that our results in 2009 outperformed the S&P by 69.6% and we have the brokerage statements to prove it!
There are two basic revenue multiples that every investor needs to be made aware of. The first, and most popular, is Price to Sales or simply P/S. The second, and the more robust metric of the two, is the Enterprise Value (Equity + Debt - Cash) to Sales or EV/S.
Price to Sales Ratio = Market Value of Equity/Revenue
Enterprise Value to Sales Ratio = (Market Value of Equity + Debt – Cash)/Revenue
The EV/S multiple is more robust than the P/S multiple because it is more accurate to look at a company’s total capital structure rather than just its equity portion. For a more detailed discussion of this please click on the following link: EBITDA: The Holy Grail of Stock Valuation
Ok, let’s look at how the P/S and EV/S can lead to different valuation outcomes. We will look at a firm with a lot of debt: Duke Energy (DUK).
In this example since DUK is highly levered, it leads to a lower value for the equity portion (equity is what the holders of the stock get).
When you look at a company with minimal debt like Electronic Arts (ERTS), you see a profound difference.
The difference is quite large and can lead to different valuation outcomes. Take your time and closely study the P/S and EV/S multiples. The driver is the debt. Duke (DUK) had quite a bit of debt. On the other side of spectrum, Electronic Arts (ERTS) carries zero debt. When you look at the P/S and EV/S you can see how debt affected the pricing of the equity. So what else is this telling us? Well if you look at the P/S ratio of Electronic Arts, it is telling us that investors are willing to pay $1.80 (rounded) for every $1 of revenue that ERTS generates. Is that a reasonable multiple to pay? It depends. This is when you need to put on your analysis cap and do some historical analysis to get a good grasp on whether the multiple today is truly a value multiple.
Pros
Unlike earnings and book value multiples, which can become negative for many companies, the revenue multiple is available for most firms. This includes startup and distressed companies. Another strength of the revenue multiple is being less susceptible to accounting tricks. Accounting plays a big role in determining net income and book value, and these values are influenced by accounting decisions on depreciation, inventory, R&D, acquisition accounting and extraordinary charges. Furthermore, revenue multiples are less volatile than earnings multiples and hence are less likely to be affected by year-to-year swings in a firm’s fortune. For instance, the price-earnings ratio (P/E) of a cyclical firm changes much more than its price-sales ratios (P/S), because earnings are much more sensitive to economic changes than revenues.
Cons
The biggest disadvantage of focusing on revenue is that it can lull you into assigning tremendous amounts of value to firms that are generating high revenue growth while actually losing significant amounts of money. Ultimately, a firm has to generate earnings and cash flows for it to have value. The revenue multiple fails in this regard quite miserably.
Overall, we at CR Investor don’t depend too heavily on the revenue multiple because our focus is on free cash flow, because this is what the shareholders are entitled to. However, the revenue multiple is an insightful data point that should be looked at and considered in the overall analysis and valuation. Furthermore, when using any type of market multiple please compare apples to apples. This means compares market multiples such as the revenue multiple to companies that are in the same line of business.
If you want to learn more about valuation please visit CRInvestor.net.
Happy Investing,Alexis Evidente
[email protected]
www.CRInvestor.net
Facebook: ClearResearch
Twitter: CR_Investor
If you really want to see our investment process in action please go to our site CRInvestor.net. You will find unbelievable research and reports that captures the true essence of value investing and education. We show our members how to become better stock pickers by sharpening their valuation skills. Our reports provide institutional level research never seen before on the retail level. We found Joe’s Jeans (JOEZ) at $0.22 which yielded an 845% return, and Hi-Shear Technology (HSR) that returned over 199% before being bought out. Not to mention that our results in 2009 outperformed the S&P by 69.6% and we have the brokerage statements to prove it!