
Customized View on the Financial Page
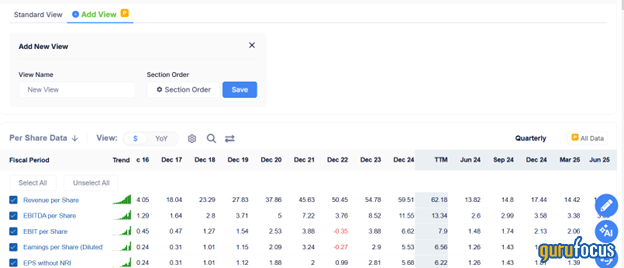
Creating a customized view on the Financials page lets you choose which metrics and financial data you want to see and how you want to see them. You can add, remove, or reorder columns to focus on the key ratios and figures that best support your investment analysis. To create a new view, please click the green “Add View” button at the top. Then you will enter the edit mode.
Then, just above the first section table, press “Section Order” to remove or add sections.
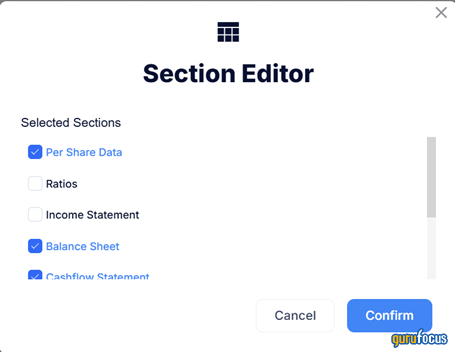
In the popup section editor, you can switch the section order by dragging them; and remove or add a section by checking or unchecking the section.
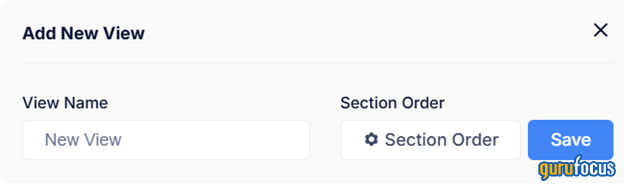
To customize your view name, type the name into the “New View” section, then click the blue “Save” button to create the new view.

You may also set the new view as the default view by clicking the “Set as Default” button.
Switch to the view you want to edit and click the “Edit This View” button. The process of editing is the same as creating a new view. After that, you can update the view by clicking the “Save” button, or create the updated view as a new one by clicking the “Save As” button.
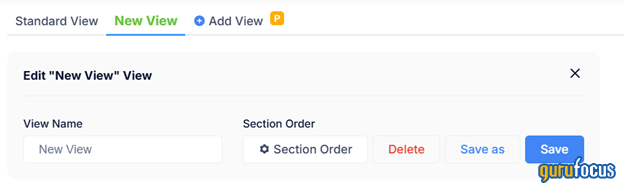
To delete the view, please click “Edit Views” to enter the edit mode, and then click the blue “Delete” button to delete it from your account.
Now you know how to make your very own customized view. If you are interested in doing this, we welcome you to sign up for our Free 7-day Trial!

