The GuruFocus Business Predictability rank has been a popular feature of the site since it was created in 2008. At that time, a study by GuruFocus found that the more consistent a company’s revenue per share and Ebitda per share over the past 10 years, the more likely it was to have posted share price gains over the same time frame.
A search through the GuruFocus All-in-One Screener reveals this principle holds true even in 2022. Approximately half of the stocks with Business Predictability ranks of 3 to 5 out of 5 stars have achieved an annualized return exceeding 10% over the past decade, compared to just a sixth of those with 2.5 or fewer stars.
Defining predictable businesses
GuruFocus ranks the predictability of companies based on the consistency of their revenue per share and earnings before interest, tax, depreciation and amortization (Ebitda) per share over the past 10 fiscal years. Companies that had an operating loss in any of the past 10 years are automatically considered unpredictable.
This is based on comments from famous value investor Warren Buffett (Trades, Portfolio) that he likes businesses that meet the following criteria:
- Simple and understandable
- Predictable and proven earnings
- Economic moat
- Can be bought at a reasonable price.
Compared to businesses with inconsistent results, those that are more consistent tend to be less prone to volatility since investors know what to expect.
Moreover, consistency is often the result of steady and reliable demand, which makes it easier for the business to scale and easier for investors to understand how the business works.
Examples of 5-star predicable businesses include Apple (AAPL), Home Depot (HD) and Mastercard (MA), while examples of 1-star predictable businesses include Chevron (CVX), Pfizer (PFE) and Verizon (VZ).
The below screenshot of the All-in-One Screener results shows the Business Predictability ranks and 10-year annualized return percentages for several mega-cap stocks. Among these names, predictable businesses like Visa (V) have performed well, while unpredictable businesses like Exxon Mobil (XOM) were more likely to show lackluster returns.

The correlation between Business Predictability and shareholder returns does not hold up in every case. For example, even though Tesla (TSLA) has a 1-star rank due to not being profitable until the past couple of years, it has a 10-year annualized return of 60% as of July 2022. In total, there are 824 (out of 6,062) stocks that have 10-year annualized returns upwards of 10% despite 1-star or lower Business Predictability ranks.

Meanwhile, there are some rare stocks that have performed poorly despite 5-star Business Predictability ranks. The All-in-One Screener finds three (out of 213) such stocks: Banco Santander Chile (BSAC), New Oriental Education & Technology Group Inc. (EDU) and Akbank TAS (AKBTY).
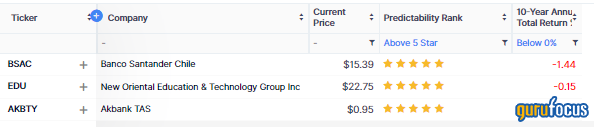
In other words, while unpredictable businesses can still have a decent chance of posting high returns, even if they are not as likely to as predictable businesses, it is relatively rare for a 5-star business to perform poorly.
Study results
Before we cover the results of the original 2008 study, the study assumptions and biases must first be clarified. The study was subject to the following biases:
- Dividend yields are not counted for investment returns.
- Effects of price changes due to spinoffs may not be fully adjusted.
- The study is subject to survivorship bias due to de-listing, bankruptcy, LBO, M&A, etc.
On average, excluding the dividends reduces the annual return of dividend-paying stocks by 2% per year, which favored unpredictable stocks, since unpredictable stocks tend to pay lower dividends.
Even without the accurate adjustment for spinoffs, the study estimates the error that this introduced to the final results was small.
Survivorship bias was identified as the biggest confounding factor. In this case, survivorship bias strongly favors unpredictable companies because many of these are startups, cyclicals or have weak financials, leading to a greater risk of insolvency and delisting. Once they are delisted, these stocks no longer show up on the screeners, removing part of the negative data for unpredictable stocks in the study.
The below chart from 2008 showed a correlation between business predictability and investment returns:

You can find the full results of the original 2008 study here.
Predictability watch
If a stock deviates from its historical predictability trend in a way that would merit a change in rank if it were to continue, it is put on Predictability Watch, which is shown by the text “On Watch” to the right of the Business Predictability rating.

If the deviation turns out to be permanent, then the rank will be changed in the future, but if it is temporary, then the stock could keep its previous rank.
Where to find the Business Predictability rank
On any stock summary page, you can find the stock’s Business Predictability rank near the top left-hand corner under the company name and stock price:

One way to screen for stocks based on the Business Predictability rank is to use the GuruFocus All-in-One Screener. Under the “Fundamental” tab, there is an option to select the “Predictability Rank” as a screening criteria:

GuruFocus also offers the Undervalued Predictable screener, which screens for stocks that have a Business Predictability rank of at least 4 out of 5 stars and appear undervalued based on the discounted cash flow calculator (earnings-based or free cash flow-based).