

According to the Peter Lynch Screen, one of several Premium GuruFocus value screens, five stocks with high profitability and business predictability that are trading below the Peter Lynch earnings line are D.R. Horton Inc. (DHI, Financial), Lennar Corp. (LEN, Financial)(LEN.B, Financial), Progressive Corp. (PGR, Financial), First American Financial Corp. (FAF, Financial) and Educational Development Corp. (EDUC, Financial).
Lynch, the legendary Fidelity Magellan Fund manager, established a simple rule to determine if a stock is undervalued or overvalued: compare the company’s share price to 15 times its earnings per share. If the price trades above the earnings line, the stock is considered overvalued. Likewise, if the price trades below the earnings line, the stock is considered undervalued.
As such, investors may find opportunities in stocks meeting Lynch’s criteria. Table 1 lists the total number of Peter Lynch Screener stocks as of Friday for each GuruFocus region.
| Region | USA | Asia | Europe | Canada | UK / Ireland | Oceania | Latin America | Africa | India |
| Peter Lynch Screener | 25 | 38 | 32 | 2 | 9 | 0 | 11 | 2 | 5 |
Table 1
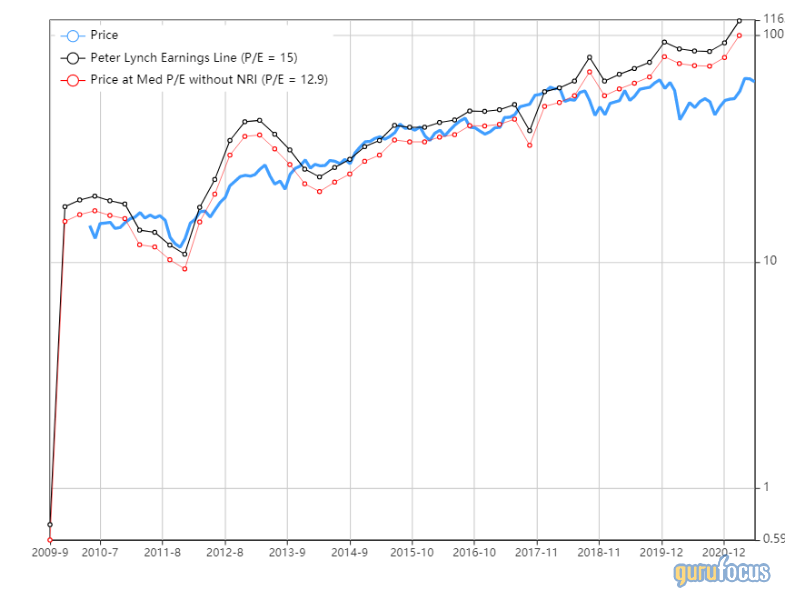
D.R. Horton
Shares of D.R. Horton (DHI, Financial) traded around $92.32, approximately 10.71 times its earnings per share. The stock’s price-earnings ratio outperforms approximately 62% of global competitors.

GuruFocus ranks the Arlington, Texas-based homebuilder’s profitability 8 out of 10 on several positive investing signs, which include a 3.5-star business predictability rank, a high Piotroski F-score of 7 and an operating margin that has increased approximately 5.7% per year on average over the past five years and is outperforming more than 80% of global competitors.

Gurus with large positions in D.R. Horton include George Soros (Trades, Portfolio)’ Soros Fund Management and David Tepper (Trades, Portfolio)’s Appaloosa Management.

Lennar
Shares of Lennar (LEN, Financial) traded around $101.24, approximately 9.37 times its earnings per share. The stock’s price-earnings ratio outperforms approximately 71% of global competitors.

GuruFocus ranks the Miami-based homebuilder’s profitability 8 out of 10 on several positive investing signs, which include a three-star business predictability rank, a high Piotroski F-score of 9 and an operating margin that has increased approximately 2.1% per year over the past five years and is outperforming over 80% of global competitors.

Gurus with holdings in Lennar include Ken Fisher (Trades, Portfolio) and Smead Value Fund (Trades, Portfolio).

Progressive
Shares of Progressive (PGR, Financial) traded around $99.04, approximately 9.01 times its earnings per share. The stock’s price-earnings ratio is near a 10-year low and outperforms approximately 64% of global competitors.

GuruFocus ranks the Mayfield Village, Ohio-based insurance company’s profitability 7 out of 10 on several positive investing signs, which include a three-star business predictability rank, a high Piotroski F-score of 8 and a net profit margin that outperforms more than 70% of global competitors.

Gurus with holdings in Progressive include Pioneer Investments (Trades, Portfolio) and Glenn Greenberg (Trades, Portfolio)’s Brave Warrior Investors.

First American Financial
Shares of First American Financial (FAF, Financial) traded around $62.23, approximately 8.06 times its earnings per share. The stock’s price-earnings ratio outperforms approximately 68% of global competitors.
GuruFocus ranks the Santa Ana, California-based insurance company’s profitability 7 out of 10 on several positive investing signs, which include a five-star business predictability rank, a high Piotroski F-score of 7 and a net margin that outperforms more than 66% of global competitors.

Educational Development
Shares of Educational Development (EDUC, Financial) traded around $12.65, approximately 8.42 times its earnings per share. The stock’s price-earnings ratio outperforms approximately 85% of global competitors.

GuruFocus ranks the Tulsa, Oklahoma-based media company’s profitability 8 out of 10 on several positive investing signs, which include a three-star business predictability rank and an operating margin that has increased approximately 8.8% per year on average over the past five years and is outperforming more than 66% of global competitors.

See also
Table 2 lists the number of stocks meeting GuruFocus’ other key value screens, including the Ben Graham Net-Net Screen, the Undervalued-Predictable Screen, the Buffett-Munger Screen and the Historical Low Price-Sales and Price-Book Screens.
| Region | USA | Asia | Europe | Canada | UK / Ireland | Oceania | Latin America | Africa | India |
| Ben Graham Net-Net Screen | 118 | 409 | 175 | 39 | 22 | 12 | 4 | 7 | 183 |
| Undervalued-Predictable Screen | 159 | 247 | 270 | 20 | 86 | 6 | 139 | 18 | 98 |
| Buffett-Munger Screen | 22 | 91 | 76 | 5 | 26 | 3 | 33 | 2 | 36 |
| Historical Low Price-Sales | 81 | 197 | 79 | 0 | 24 | 0 | 38 | 13 | 15 |
| Historical Low Price-Book | 98 | 236 | 101 | 2 | 38 | 0 | 65 | 15 | 24 |
Table 2
Also check out: