

As investors continue monitoring political developments around the globe, GuruFocus’ value screeners, a Premium feature, help investors find opportunities by applying teachings from several investing legends, including Benjamin Graham, Peter Lynch and Berkshire Hathaway Inc. (BRK.A, Financial)(BRK.B, Financial) CEO Warren Buffett (Trades, Portfolio).
Dow tumbles as investors monitor geopolitical concerns
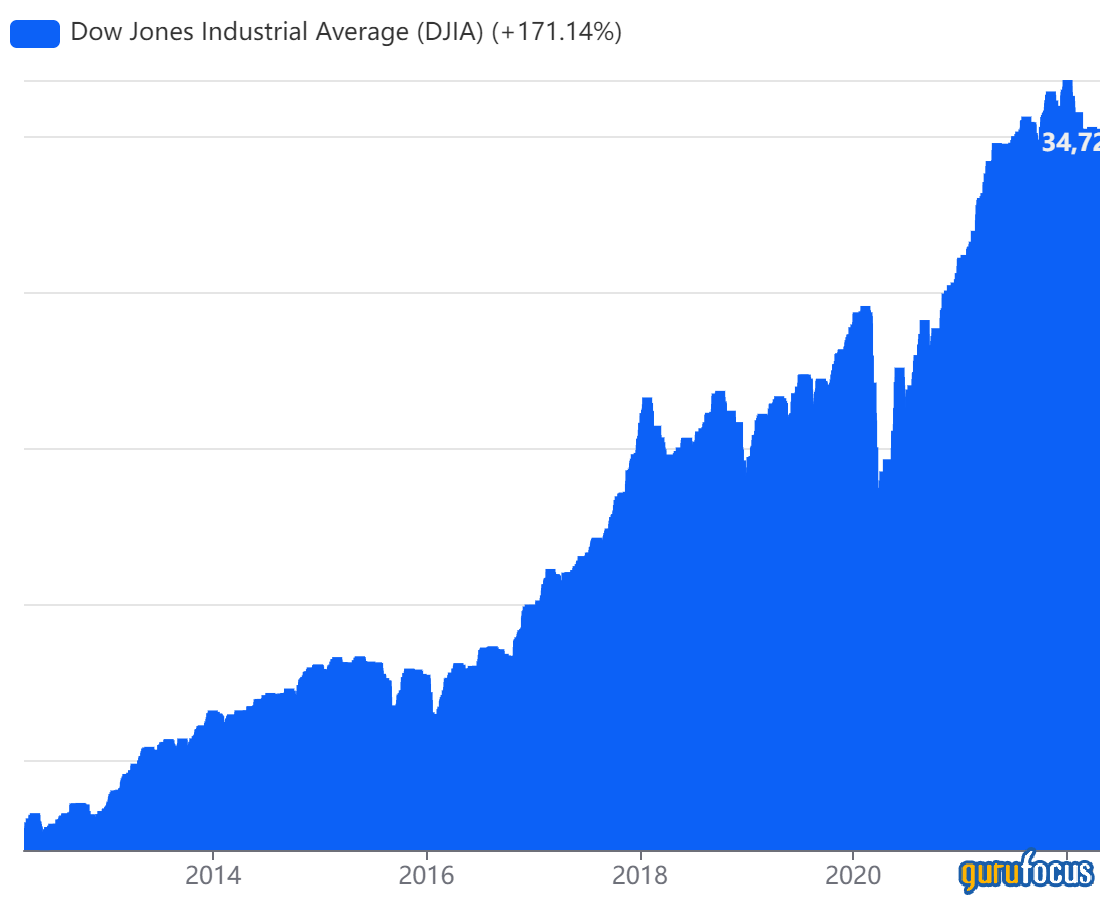
On Monday, the Dow Jones Industrial Average traded around 34,498.42, down 222.70 points from last Friday’s close of 34,721.12.
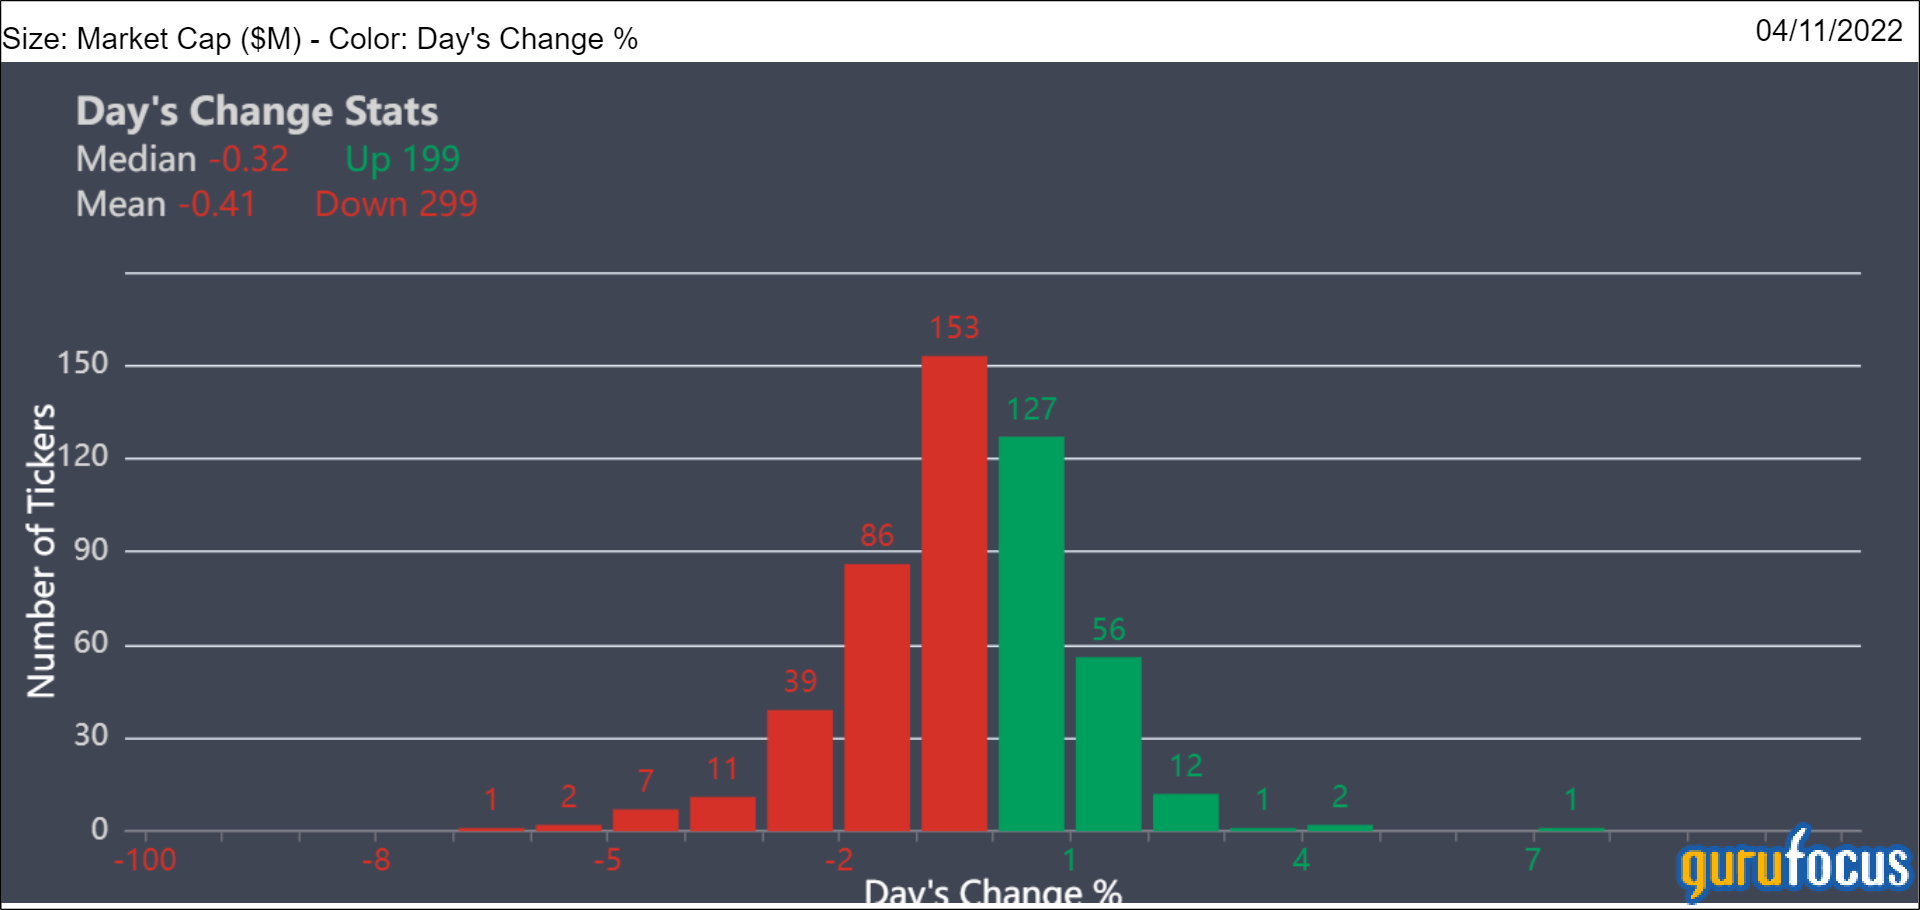
Stocks tumbled as investors continued monitoring developments regarding Russia’s invasion of Ukraine and Covid-19 lockdowns in China. According to the Aggregated Statistics chart, a Premium feature, the mean day’s change of the Standard & Poor’s 500 index stocks is -0.41% with a median of -0.32%.
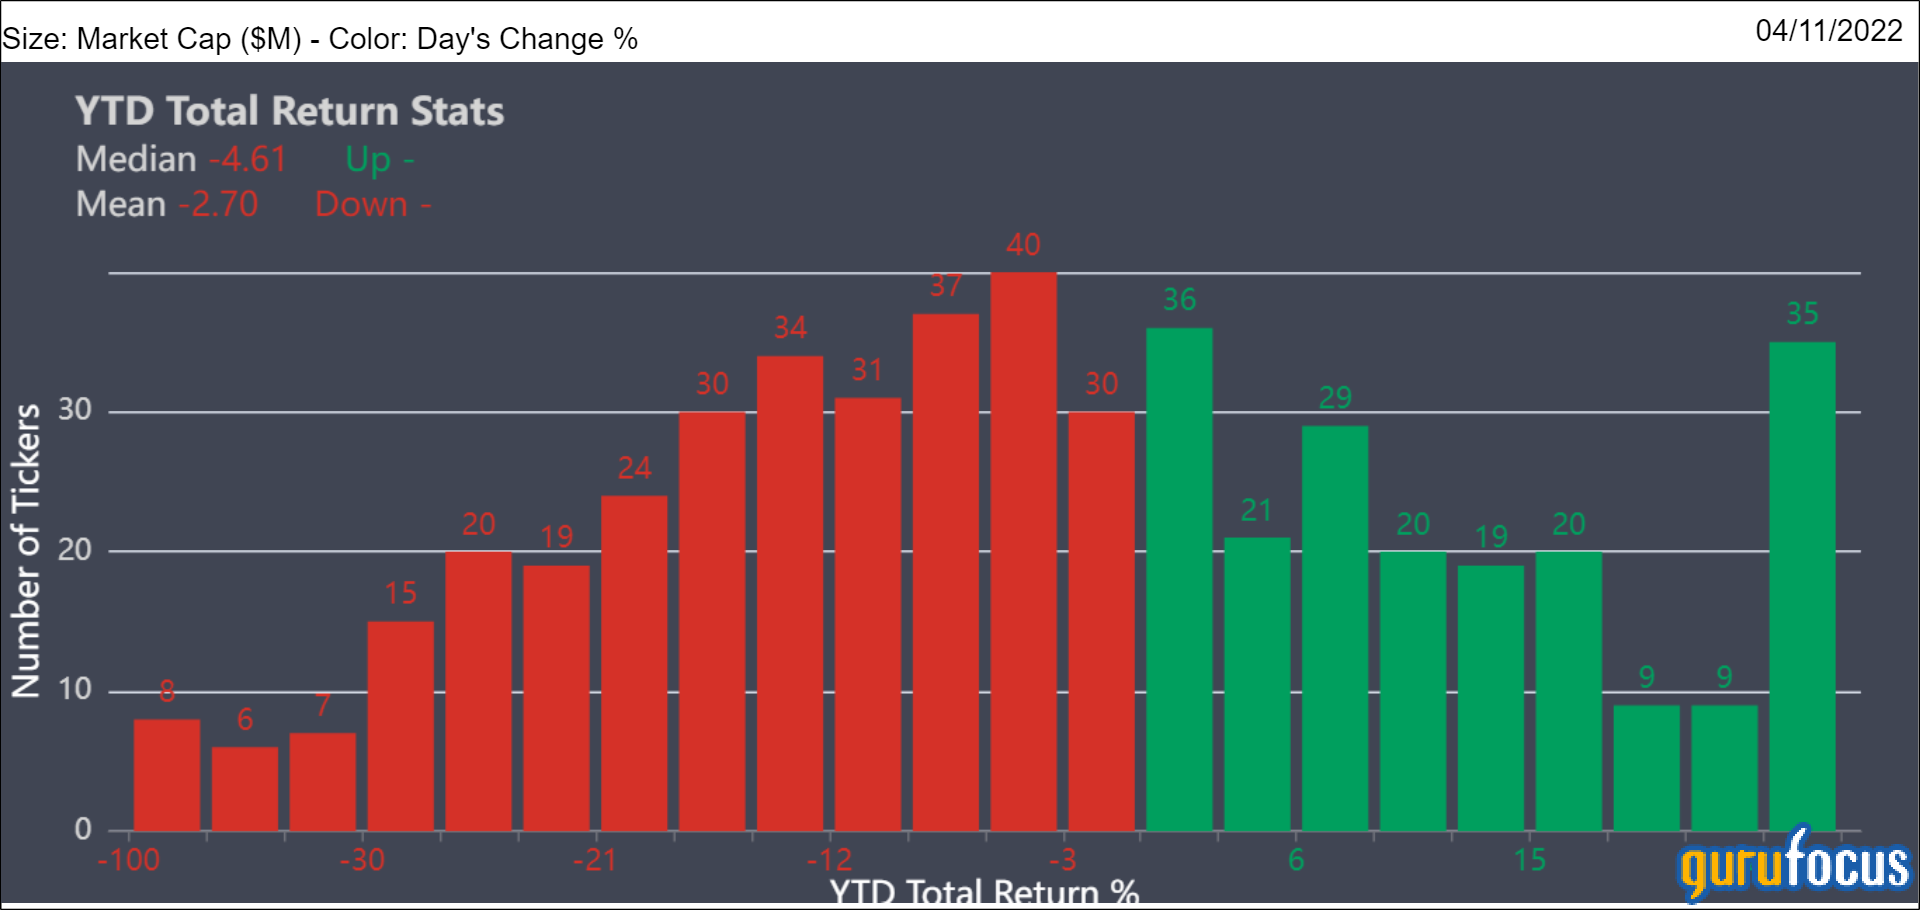
The mean year-to-date total return for S&P 500 stocks is -2.70% with a median of -4.61%.
As investors monitor uncertainty in the markets, GuruFocus’ value screeners continue helping investors find investing opportunities.
Ben Graham Net-Net
Graham said in his book, “The Intelligent Investor,” that the idea behind the net-net investing strategy is to purchase shares of companies trading less than 66% of net current asset value. The “Father of Value Investing” defined net current asset value as current assets minus total liabilities. The net-net working capital calculation adjusts current assets as the sum of cash and short-term investments, 75% of accounts receivable and 50% of inventory.
Table 1 lists the number of Ben Graham Net-Net stocks for each GuruFocus region.
| Region | USA | Asia | Europe | Canada | UK / Ireland | Oceania | Latin America | Africa | India |
| Ben Graham Net-net Stocks | 240 | 463 | 242 | 42 | 16 | 10 | 7 | 9 | 154 |
Table 1
Undervalued-Predictable and Buffett-Munger
The Undervalued-Predictable Screener looks for stocks that have high business predictability and are trading at a discount to intrinsic value based on the discounted cash flow model. The Buffett-Munger Screener considers other criteria according to Buffett and Charlie Munger (Trades, Portfolio)’s investing approach, including low debt-to-asset growth and low price-earnings-to-growth ratios.
Table 2 lists the number of Undervalued-Predictable and Buffett-Munger stocks for each GuruFocus region.
| Region | USA | Asia | Europe | Canada | UK / Ireland | Oceania | Latin America | Africa | India |
| Undervalued-Predictable Stocks | 203 | 285 | 357 | 19 | 57 | 11 | 181 | 25 | 71 |
| Buffett-Munger stocks | 47 | 120 | 136 | 8 | 26 | 6 | 62 | 3 | 32 |
Table 2
Peter Lynch Screen
The Peter Lynch Screen looks for stocks that trade below the legendary Fidelity Magellan Fund manager’s earnings line. Lynch set the earnings line at 15 times earnings per share.
Table 3 lists the number of Peter Lynch stocks for each GuruFocus region.
| Region | USA | Asia | Europe | Canada | UK / Ireland | Oceania | Latin America | Africa | India |
| Peter Lynch Stocks | 125 | 153 | 117 | 5 | 19 | 3 | 41 | 5 | 7 |
Table 3