
Long-established in the Travel & Leisure industry, Norwegian Cruise Line Holdings Ltd (NCLH, Financial) has enjoyed a stellar reputation. However, it has recently witnessed a daily loss of 4.8%, juxtaposed with a three-month change of -26.98%. Fresh insights from the GF Score hint at potential headwinds. Notably, its diminished rankings in financial strength, growth, and valuation suggest that the company might not live up to its historical performance. Join us as we dive deep into these pivotal metrics to unravel the evolving narrative of Norwegian Cruise Line Holdings Ltd.
What Is the GF Score?
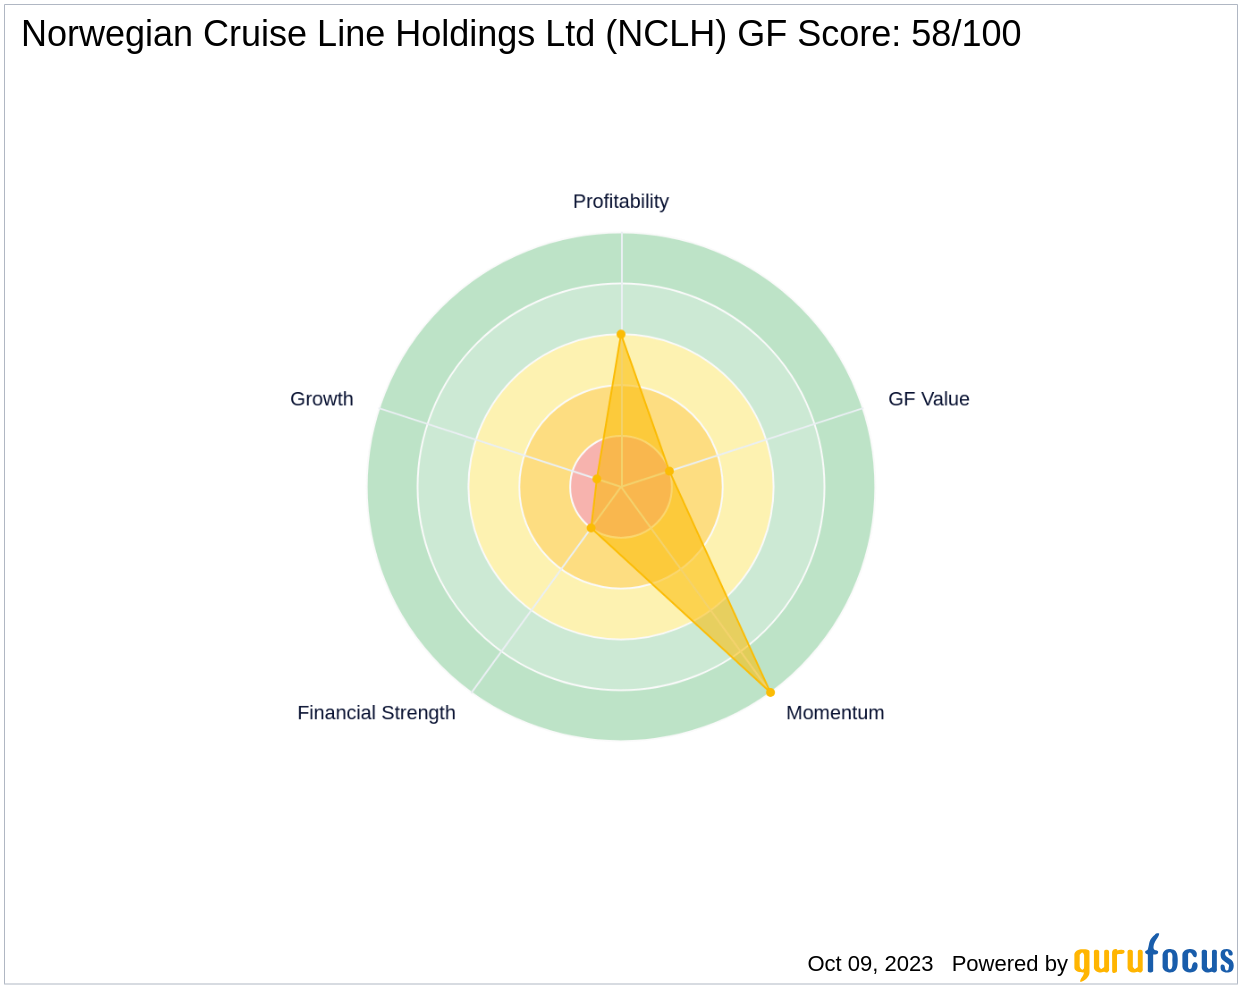
The GF Score is a stock performance ranking system developed by GuruFocus using five aspects of valuation, which has been found to be closely correlated to the long-term performances of stocks by backtesting from 2006 to 2021. The stocks with a higher GF Score generally generate higher returns than those with a lower GF Score. Therefore, when picking stocks, investors should invest in companies with high GF Scores. The GF Score ranges from 0 to 100, with 100 as the highest rank.
- Financial strength rank: 2/10
- Profitability rank: 6/10
- Growth rank: 1/10
- GF Value rank: 2/10
- Momentum rank: 10/10
Based on the above method, GuruFocus assigned Norwegian Cruise Line Holdings Ltd the GF Score of 58 out of 100, which signals poor future outperformance potential.
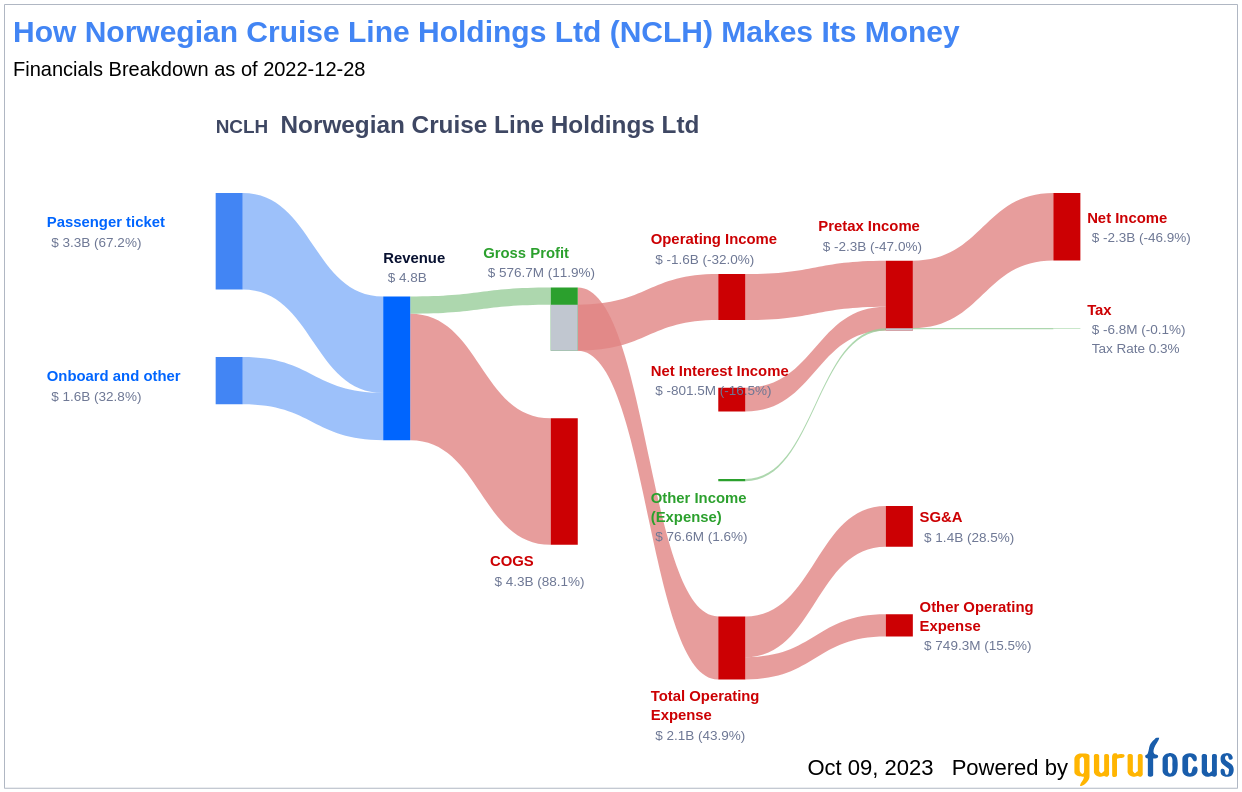
Understanding Norwegian Cruise Line Holdings Ltd Business
Norwegian Cruise Line is the world's third-largest cruise company by berths, operating 30 ships across three brands (Norwegian, Oceania, and Regent Seven Seas), offering both freestyle and luxury cruising. The company had redeployed its entire fleet as of May 2022. With seven passenger vessels on order among its brands through 2028, Norwegian is increasing capacity faster than its peers, expanding its brand globally. Norwegian sails to around 700 global destinations.
Financial Strength Breakdown
Norwegian Cruise Line Holdings Ltd's financial strength indicators present some concerning insights about the company's balance sheet health. The company's interest coverage ratio of 0, positions it worse than 0% of 566 companies in the Travel & Leisure industry. This ratio highlights potential challenges the company might face when handling its interest expenses on outstanding debt.
The company's Altman Z-Scoreis just -0.22, which is below the distress zone of 1.81. This suggests that the company may face financial distress over the next few years. Additionally, the company's low cash-to-debt ratio at 0.07 indicates a struggle in handling existing debt levels.
The company's debt-to-equity ratio is 903.85, which is worse than 100% of 663 companies in the Travel & Leisure industry. A high debt-to-equity ratio suggests over-reliance on borrowing and vulnerability to market fluctuations. Additionally, the company's debt-to-Ebitda ratio is 21.12, which is above Joel Tillinghast's warning level of 4 and is worse than 93.83% of 583 companies in the Travel & Leisure industry.
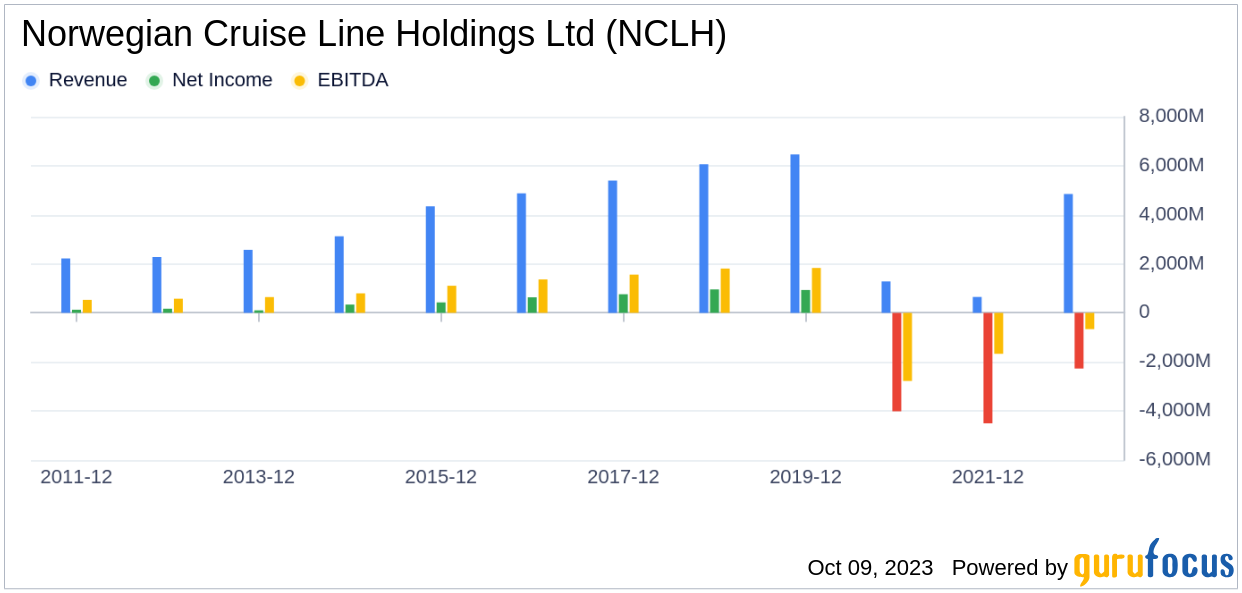
Growth Prospects
A lack of significant growth is another area where Norwegian Cruise Line Holdings Ltd seems to falter, as evidenced by the company's low Growth rank. The company's revenue has declined by -27.2 per year over the past three years, which underperforms worse than 87.2% of 758 companies in the Travel & Leisure industry. Stagnating revenues may pose concerns in a fast-evolving market.
Lastly, Norwegian Cruise Line Holdings Ltd predictability rank is just one star out of five, adding to investor uncertainty regarding revenue and earnings consistency.
Conclusion
Given the company's financial strength, profitability, and growth metrics, the GF Score highlights the firm's unparalleled position for potential underperformance. While Norwegian Cruise Line Holdings Ltd has a rich history and a strong brand, its current financial health and growth prospects raise concerns about its future performance. Investors should consider these factors when making investment decisions.
GuruFocus Premium members can find more companies with strong GF Scores using the following screener link: GF Score Screen
This article, generated by GuruFocus, is designed to provide general insights and is not tailored financial advice. Our commentary is rooted in historical data and analyst projections, utilizing an impartial methodology, and is not intended to serve as specific investment guidance. It does not formulate a recommendation to purchase or divest any stock and does not consider individual investment objectives or financial circumstances. Our objective is to deliver long-term, fundamental data-driven analysis. Be aware that our analysis might not incorporate the most recent, price-sensitive company announcements or qualitative information. GuruFocus holds no position in the stocks mentioned herein.