

Value-focused investors are always on the lookout for stocks trading below their intrinsic value. Carnival Corp (CCL, Financial) is one such stock that demands attention. Currently priced at $16.35 with a day's gain of 3.74% and a 3-month increase of 4.16%, Carnival appears to be a candidate for undervaluation with a GF Value of $32.47. However, the true picture of an investment opportunity is often more nuanced.
Understanding GF Value
The GF Value is a proprietary measure that indicates the intrinsic value of a stock based on historical trading multiples, adjustments for past performance, and future business projections. Ideally, a stock's price will hover around its GF Value, signaling fair valuation. Stocks trading significantly above the GF Value might be overvalued and could yield poor future returns, while those below could offer higher returns.
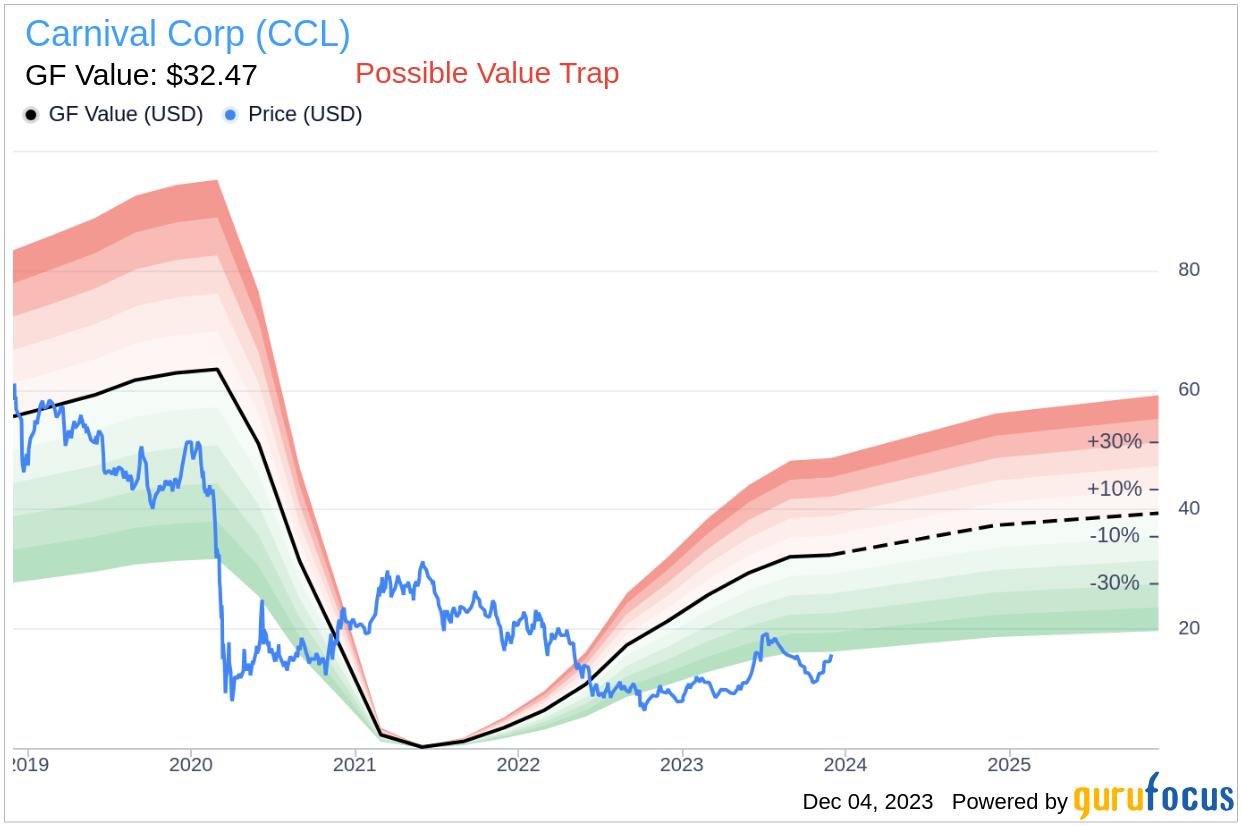
Despite Carnival's attractive GF Value, a deeper dive into the company's financial health is crucial. Red flags such as a low Altman Z-score of 0.57 and a five-year downward trend in revenue and Earnings Per Share (EPS) suggest that Carnival might be a potential value trap. Investors must exercise thorough due diligence before taking a plunge into this stock.
Decoding Financial Distress Indicators
The Altman Z-score is a predictive model for assessing the likelihood of bankruptcy. A score below 1.8 indicates high financial distress, while above 3 suggests low risk. Carnival's dismal Z-score of 0.57 is a stark warning, implying that the company could face significant financial challenges.
Snapshot of Carnival's Business
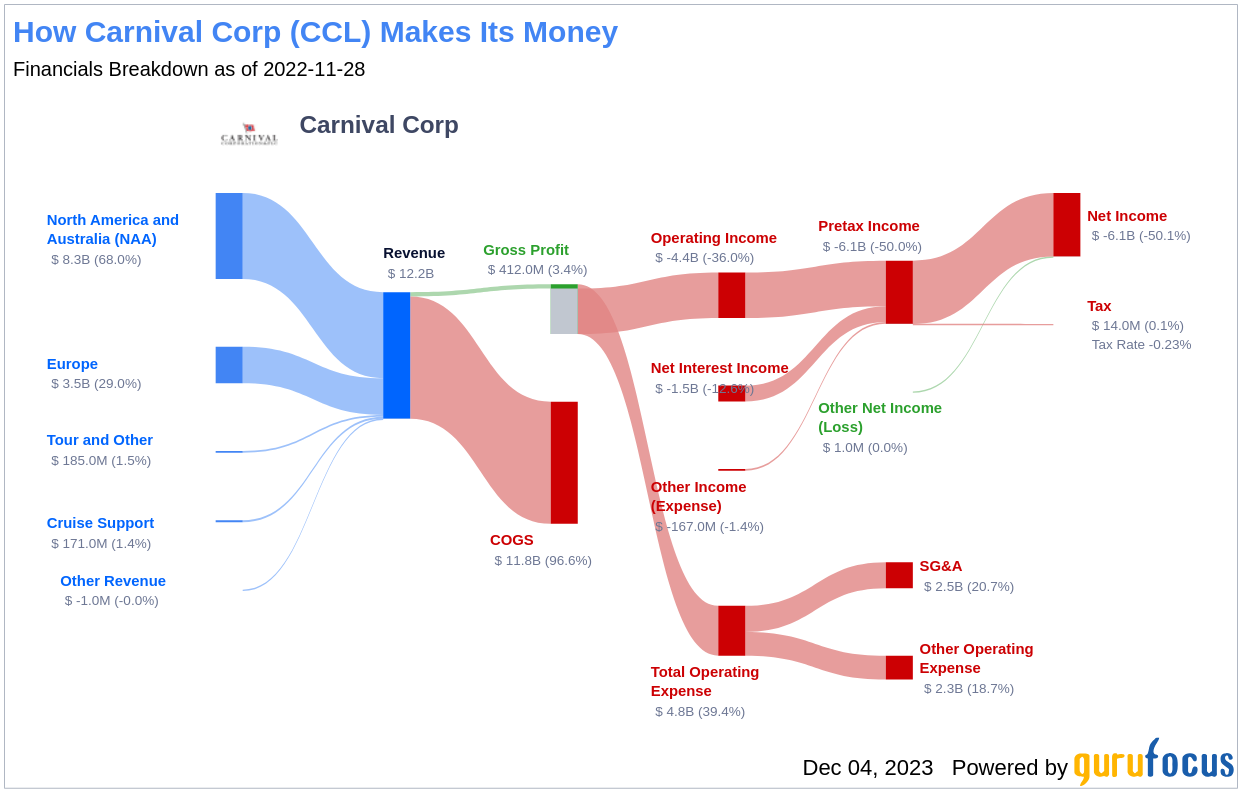
Carnival, the largest global cruise company, operates an impressive fleet of 90 ships. With a diverse portfolio of brands catering to various geographic regions and market segments, Carnival attracted roughly 13 million guests in 2019. Despite this impressive reach, the company's financial metrics, including a market cap of $21.40 billion and sales of $20 billion, must be weighed against its financial health indicators to ascertain the stock's true value.
The Concern Over Carnival's Altman Z-Score
Examining Carnival's financial ratios and historical data reveals a troubling trend. The Retained Earnings to Total Assets ratio, a key component of the Altman Z-Score, has been in decline: 2021: 0.17; 2022: 0.04; 2023: 0.01. This indicates a weakening ability to reinvest profits or manage debt, further pressuring Carnival's financial stability.
Warning Signs in Revenue and Earnings
Revenue per share is a critical indicator of a company's health. For Carnival, the past five years have shown a worrisome decline: 2019: $29.52; 2020: $15.01; 2021: $0.58; 2022: $8.30; 2023: $15.37. Alongside a 5-year revenue growth rate of -32.8%, these figures suggest potential challenges, such as reduced demand or increased competition, that could jeopardize future performance.
The Earnings Growth Red Flag
Despite a seemingly favorable price-to-fair-value ratio, Carnival's declining revenues and earnings overshadow its attractiveness as an investment. The company's fundamentals are not only unsound but appear to be deteriorating. Without a clear strategy for recovery, Carnival's stock could face further declines, transforming what seems like a value opportunity into a value trap.
Conclusion: Navigating the Value Trap
Carnival's financial indicators, including a low Altman Z-Score, declining retained earnings, and falling revenue and earnings, all point to a stock that may be more of a value trap than a value investment. While its GF Value suggests potential undervaluation, the underlying financial health of the company raises serious concerns. Investors seeking stocks with robust financials can utilize tools like the Walter Schloss Screen and the Peter Lynch Growth with Low Valuation Screener offered by GuruFocus Premium. In the case of Carnival, the prudent course of action may be to steer clear until signs of a sustainable turnaround emerge.
This article, generated by GuruFocus, is designed to provide general insights and is not tailored financial advice. Our commentary is rooted in historical data and analyst projections, utilizing an impartial methodology, and is not intended to serve as specific investment guidance. It does not formulate a recommendation to purchase or divest any stock and does not consider individual investment objectives or financial circumstances. Our objective is to deliver long-term, fundamental data-driven analysis. Be aware that our analysis might not incorporate the most recent, price-sensitive company announcements or qualitative information. GuruFocus holds no position in the stocks mentioned herein.