
Long-established in the Consumer Packaged Goods industry, JM Smucker Co (SJM, Financial) has enjoyed a stellar reputation. It has recently witnessed a daily gain of 0.93%, juxtaposed with a three-month change of 5.54%. However, fresh insights from the GF Score hint at potential headwinds. Notably, its diminished rankings in financial strength, growth, and valuation suggest that the company might not live up to its historical performance. Join us as we dive deep into these pivotal metrics to unravel the evolving narrative of JM Smucker Co.
What Is the GF Score?
The GF Score is a stock performance ranking system developed by GuruFocus using five aspects of valuation, which has been found to be closely correlated to the long-term performances of stocks by backtesting from 2006 to 2021. The stocks with a higher GF Score generally generate higher returns than those with a lower GF Score. Therefore, when picking stocks, investors should invest in companies with high GF Scores. The GF Score ranges from 0 to 100, with 100 as the highest rank.
- Financial strength rank: 4/10
- Profitability rank: 7/10
- Growth rank: 5/10
- GF Value rank: 5/10
- Momentum rank: 2/10
Based on the above method, GuruFocus assigned JM Smucker Co the GF Score of 69 out of 100, which signals poor future outperformance potential.
Understanding JM Smucker Co Business
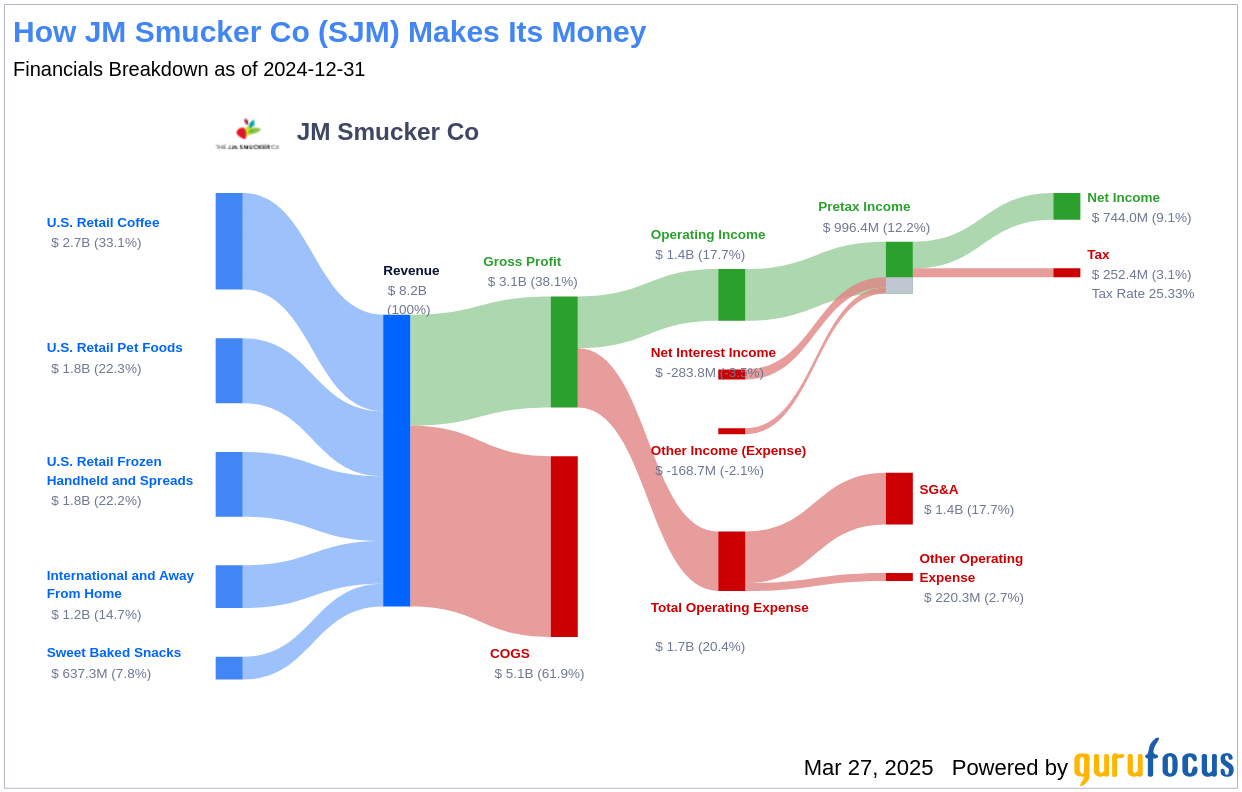
JM Smucker Co is a packaged food company with a market cap of $12.3 billion and sales amounting to $8.8 billion. The company primarily sells through the US retail channel, with 78% of its fiscal 2024 revenue coming from its retail pet foods, coffee, and frozen handheld/spreads segments. Retail coffee is its largest category, accounting for 33% of sales, with brands like Folgers and Dunkin'. Pet foods, which make up 22% of sales, include leading brands such as Milk-Bone and Meow Mix. The remaining 22% of revenue comes from consumer foods, primarily peanut butter and jelly, through brands like Jif and Smucker's. The company recently acquired Hostess Brands to enhance its presence in the snack and convenience store market.
Financial Strength Breakdown
JM Smucker Co's financial strength indicators present some concerning insights about the company's balance sheet health. JM Smucker Co has an interest coverage ratio of 4.33, which positions it worse than 65.77% of 1,446 companies in the Consumer Packaged Goods industry. This ratio highlights potential challenges the company might face when handling its interest expenses on outstanding debt. It's worth noting that the esteemed investor Benjamin Graham typically favored companies with an interest coverage ratio of at least five.
The company's Altman Z-Score is just 1.19, which is below the distress zone of 1.81. This suggests that the company may face financial distress over the next few years. Additionally, the company's low cash-to-debt ratio at 0.01 indicates a struggle in handling existing debt levels.
Additionally, the company's debt-to-Ebitda ratio is 9.24, which is above Joel Tillinghast's warning level of 4 and is worse than 90% of 1,490 companies in the Consumer Packaged Goods industry. Tillinghast said in his book “Big Money Think's Small: Biases, Blind Spots, and Smarter Investing” that a high debt-to-Ebitda ratio can be a red flag unless tangible assets cover the debt.
Next Steps
Given the company's financial strength, profitability, and growth metrics, the GF Score highlights JM Smucker Co's potential for underperformance. Investors should carefully consider these factors when evaluating the company's future prospects. For those seeking companies with stronger GF Scores, GuruFocus Premium members can explore more options using the following screener link: GF Score Screen.
This article, generated by GuruFocus, is designed to provide general insights and is not tailored financial advice. Our commentary is rooted in historical data and analyst projections, utilizing an impartial methodology, and is not intended to serve as specific investment guidance. It does not formulate a recommendation to purchase or divest any stock and does not consider individual investment objectives or financial circumstances. Our objective is to deliver long-term, fundamental data-driven analysis. Be aware that our analysis might not incorporate the most recent, price-sensitive company announcements or qualitative information. GuruFocus holds no position in the stocks mentioned herein.