

Mizuho has revised its price target for Bill.com (BILL, Financial), lowering it from $70 to $53, while maintaining a Neutral stance on the stock. This adjustment is part of a broader review of the software sector as the firm anticipates first-quarter earnings reports. The adjustment reflects a recent compression in software company valuations.
Despite the downward revision in price targets across the software sector, Mizuho analysts view the recent decline in stock prices as a potential investment opportunity. They suggest that this might be a favorable time for investors to consider buying, taking advantage of the market correction.
Mizuho forecasts robust earnings for the first quarter, although they expect company leaders to adopt a cautious outlook regarding the remainder of the fiscal year. The firm also notes that current tariff conditions are not expected to disrupt the essential elements of the software-as-a-service market.
Wall Street Analysts Forecast
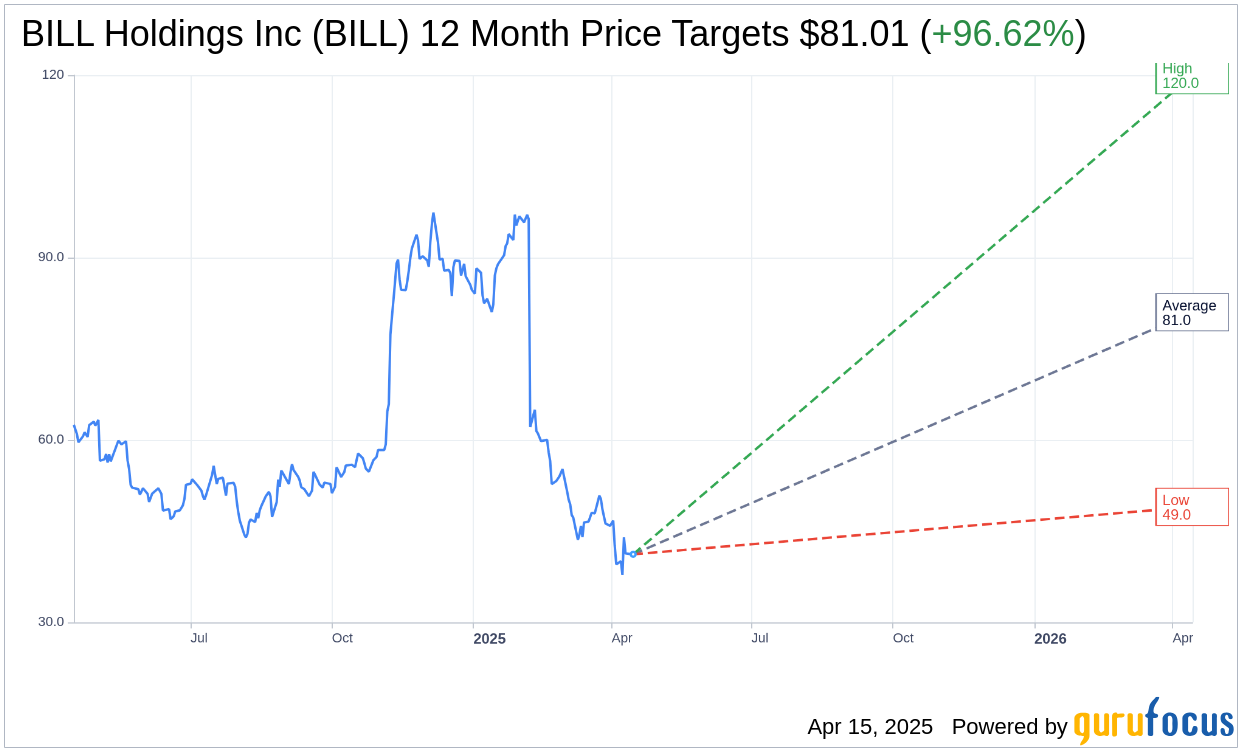
Based on the one-year price targets offered by 23 analysts, the average target price for BILL Holdings Inc (BILL, Financial) is $81.01 with a high estimate of $120.00 and a low estimate of $49.00. The average target implies an upside of 96.62% from the current price of $41.20. More detailed estimate data can be found on the BILL Holdings Inc (BILL) Forecast page.
Based on the consensus recommendation from 25 brokerage firms, BILL Holdings Inc's (BILL, Financial) average brokerage recommendation is currently 2.2, indicating "Outperform" status. The rating scale ranges from 1 to 5, where 1 signifies Strong Buy, and 5 denotes Sell.
Based on GuruFocus estimates, the estimated GF Value for BILL Holdings Inc (BILL, Financial) in one year is $159.33, suggesting a upside of 286.72% from the current price of $41.2. GF Value is GuruFocus' estimate of the fair value that the stock should be traded at. It is calculated based on the historical multiples the stock has traded at previously, as well as past business growth and the future estimates of the business' performance. More detailed data can be found on the BILL Holdings Inc (BILL) Summary page.