
VersaBank (VBNK, Financial) has obtained the green light from the Toronto Stock Exchange to carry out a Normal Course Issuer Bid (NCIB) for its common shares. This program enables the bank to repurchase and cancel up to 2 million common shares, roughly 8.99% of its public float. As of April 21, the public float was composed of 22,237,283 common shares, with a total of 32,518,786 common shares issued and outstanding.
The average daily trading volume of VersaBank's common shares on the TSX from October 1, 2024, to March 31, 2025, was recorded at 37,761 shares. According to the NCIB rules, the daily repurchases are capped at 25% of this average daily trading volume, translating to a maximum of 9,440 shares per day.
The repurchase initiative will commence on April 30, 2025, and extend until April 29, 2026, although it may conclude sooner if the bank fulfills its share purchase goals. All shares acquired through this program will be canceled, contributing to a potential reduction in the total number of shares outstanding.
Wall Street Analysts Forecast
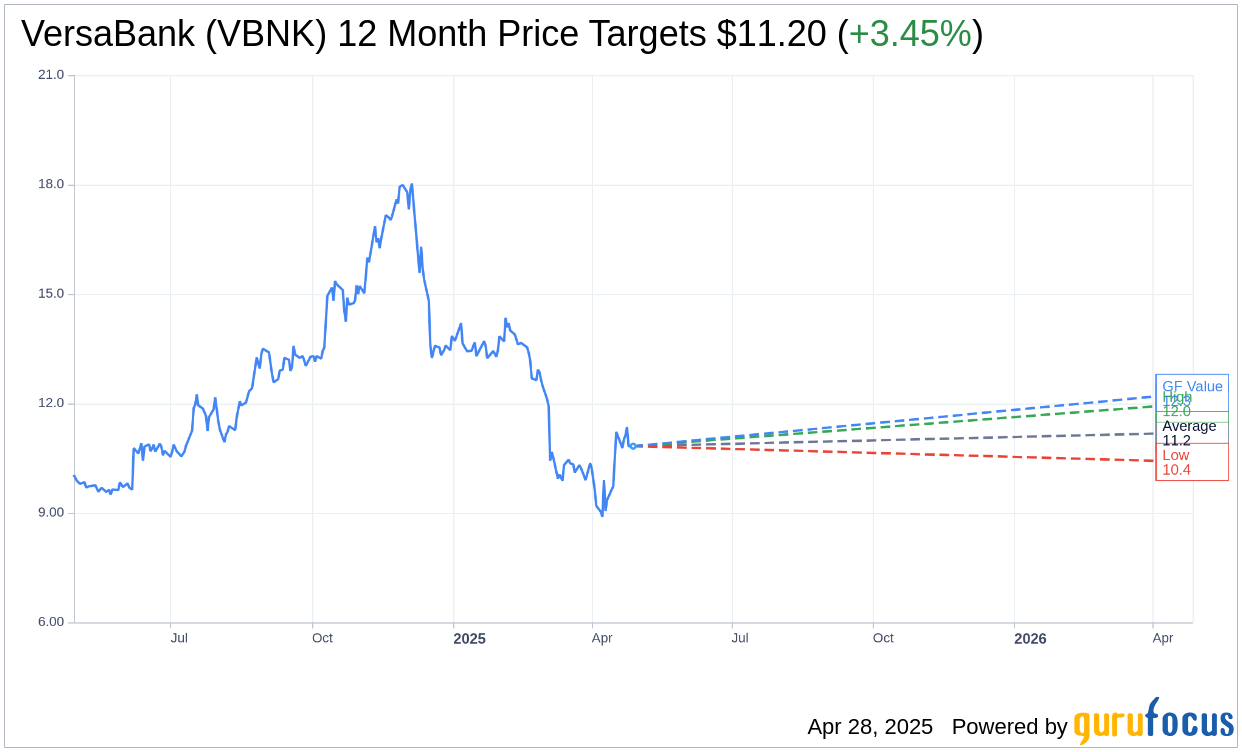
Based on the one-year price targets offered by 2 analysts, the average target price for VersaBank (VBNK, Financial) is $11.20 with a high estimate of $12.00 and a low estimate of $10.40. The average target implies an upside of 3.45% from the current price of $10.83. More detailed estimate data can be found on the VersaBank (VBNK) Forecast page.
Based on the consensus recommendation from 1 brokerage firms, VersaBank's (VBNK, Financial) average brokerage recommendation is currently 3.0, indicating "Hold" status. The rating scale ranges from 1 to 5, where 1 signifies Strong Buy, and 5 denotes Sell.
Based on GuruFocus estimates, the estimated GF Value for VersaBank (VBNK, Financial) in one year is $12.29, suggesting a upside of 13.48% from the current price of $10.83. GF Value is GuruFocus' estimate of the fair value that the stock should be traded at. It is calculated based on the historical multiples the stock has traded at previously, as well as past business growth and the future estimates of the business' performance. More detailed data can be found on the VersaBank (VBNK) Summary page.
VBNK Key Business Developments
Release Date: March 05, 2025
- Total Assets: Grew 15% year-over-year and 3% sequentially to just under $5 billion.
- Cash and Securities: $545 million, representing 11% of total assets.
- Book Value per Share: Increased to a record $16.03.
- CET1 Ratio: Increased to 14.61%.
- Leverage Ratio: 9.67%.
- Total Consolidated Revenue: $27.8 million, compared to $28.9 million last year.
- Consolidated Non-Interest Expense: $15.7 million, up from $12 million in Q1 last year.
- Canadian Banking Operations Revenue: $23.8 million.
- Canadian Banking Operations Net Income: $8.8 million or $0.30 per share.
- U.S. Banking Operations Revenue: $2 million.
- U.S. Banking Operations Income: $103,000.
- DRT Cyber Revenue: $2 million, up from $1.9 million in Q1 last year.
- DRT Cyber Net Loss: $757,000.
- Credit Asset Portfolio: Grew to $4.35 billion, with RPP portfolio representing 79%.
- Net Interest Margin on Credit Assets: 2.36%, 27 basis points lower year-over-year.
- Provision for Credit Losses: Increased to 0.09% on average credit assets.
For the complete transcript of the earnings call, please refer to the full earnings call transcript.
Positive Points
- VersaBank (VBNK, Financial) signed its first U.S. partner, Watercross Financial, following the U.S. bank acquisition, marking a significant step in its expansion strategy.
- The bank completed a successful $86 million capital raise, including full execution of the over-allotment option, to support its U.S. RPP opportunity.
- VersaBank (VBNK) achieved a record for total assets, with a 15% year-over-year growth, reaching nearly $5 billion.
- The Canadian digital banking operations continue to demonstrate strong operating leverage, contributing to efficiency and return on common equity.
- The bank's CET1 ratio increased to 14.61%, and the leverage ratio was 9.67%, both remaining above internal targets, indicating strong capital adequacy.
Negative Points
- The U.S. operations are currently incurring full costs without generating significant revenue, impacting overall profitability.
- Total consolidated revenue decreased slightly year-over-year, driven by lower net interest margin and non-interest income.
- Non-interest expenses increased due to incremental operating costs associated with U.S. operations and higher costs to support anticipated business activities.
- The net interest margin on credit assets was lower year-over-year due to the lag effect of an atypical inverted yield curve.
- Provision for credit losses increased due to changes in forward-looking information, reflecting a more unstable credit environment.