

Fulton Financial Corporation (FULT, Financial) has announced its financial results for the second quarter, revealing an increase in net interest margin. The figure rose to 3.47%, up from 3.43% in the same period last year, indicating a positive shift in the company's profitability from its lending activities. This improvement reflects the company's ability to generate more interest income from its assets relative to its interest expenses, showcasing its strong performance in the current economic climate.
Wall Street Analysts Forecast
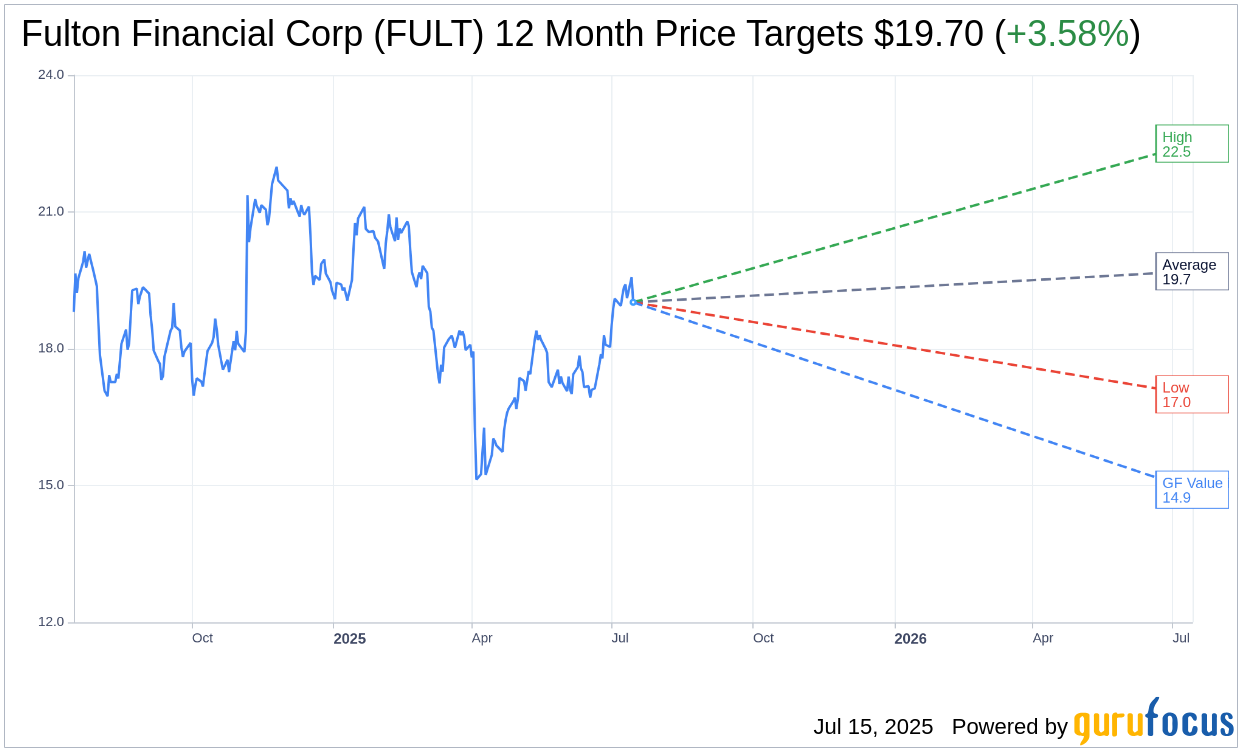
Based on the one-year price targets offered by 5 analysts, the average target price for Fulton Financial Corp (FULT, Financial) is $19.70 with a high estimate of $22.50 and a low estimate of $17.00. The average target implies an upside of 3.58% from the current price of $19.02. More detailed estimate data can be found on the Fulton Financial Corp (FULT) Forecast page.
Based on the consensus recommendation from 6 brokerage firms, Fulton Financial Corp's (FULT, Financial) average brokerage recommendation is currently 2.3, indicating "Outperform" status. The rating scale ranges from 1 to 5, where 1 signifies Strong Buy, and 5 denotes Sell.
Based on GuruFocus estimates, the estimated GF Value for Fulton Financial Corp (FULT, Financial) in one year is $14.91, suggesting a downside of 21.61% from the current price of $19.02. GF Value is GuruFocus' estimate of the fair value that the stock should be traded at. It is calculated based on the historical multiples the stock has traded at previously, as well as past business growth and the future estimates of the business' performance. More detailed data can be found on the Fulton Financial Corp (FULT) Summary page.
FULT Key Business Developments
Release Date: April 16, 2025
- Operating Earnings Per Share: $0.52, a $0.04 increase linked quarter.
- Operating Efficiency Ratio: 56.7%.
- Operating Return on Assets: 1.25%.
- Operating Return on Average Tangible Common Equity: 15.95%.
- Tangible Book Value Per Share Growth: 13.8% annualized.
- Deposit Growth: $200 million or 3% driven by interest-bearing money market products.
- Total Loans Decline: $182 million during the quarter.
- Net Interest Income: $251 million, a $2.5 million decrease linked quarter.
- Net Interest Margin: Increased 2 basis points to 3.43%.
- Loan Yields: Declined 11 basis points to 5.86%.
- Average Cost of Total Deposits: Decreased 11 basis points to 2.03%.
- Noninterest Income: $67.2 million.
- Non-interest Expense: $182.9 million, a decrease of $7.8 million linked quarter.
- Provision Expense: Declined approximately $2.8 million to $13.9 million.
- Allowance for Credit Losses to Total Loans Ratio: Increased to 159%.
- Common Equity Tier 1 (CET1) Ratio: 11%.
For the complete transcript of the earnings call, please refer to the full earnings call transcript.
Positive Points
- Fulton Financial Corp (FULT, Financial) reported an increase in operating earnings per share to $0.52, a $0.04 rise from the previous quarter.
- The company achieved a reduction in total operating expenses, contributing to an improved operating efficiency ratio of 56.7%.
- FULT maintained strong liquidity and grew its equity base, with tangible book value per share increasing by 13.8% on an annualized basis.
- Customer deposit growth was solid, with a $200 million increase driven by interest-bearing money market products.
- The company reported improvements in asset quality metrics, including a decline in the non-performing loan ratio and net charge-offs.
Negative Points
- Total loans declined by $182 million during the quarter, impacted by strategic decisions and portfolio management activities.
- Loan yields decreased by 11 basis points to 5.86%, contributing to a $2.5 million decrease in net interest income.
- The allowance for credit losses to total loans ratio increased, indicating a cautious outlook on credit quality.
- FULT's non-interest income declined modestly due to day count and transactional activity, with fee income as a percentage of revenue at 21%.
- The company anticipates potential headwinds in net interest income and non-interest income due to a slower growth environment and possible interest rate cuts.