GuruFocus' All-in-one Guru Screener allows users to screen using technical indicators like the relative strength index and simple moving average. In 2024, the Screener added additional technical indicator filters, which include exponential moving average, moving average convergence divergence (MACD), golden cross pattern and death cross pattern.
Background
Figure 1 gives a screen shot illustrating a wide range of technical indicators listed under the Screener's Price tab.

Figure 1
You screen for these filters as you would for any other filter. For example, if you want to look for companies with a 14-day relative strength index (RSI) less than 30, you would select the second drop-down menu for “14-Day RSI” and choose 30 from the list of values as Figure 2 illustrates.

Figure 2
How it works
GuruFocus' All-in-one Screener supports screening for a wide range of technical indicators, including the relative strength index (RSI), the six-month price index, the simple moving average, Bollinger Bands, and momentum indicators like 6-1 month momentum and 12-1 month momentum. Each technical indicator can give insights on how a company's stock price might trend going forward.
For example, you can look for undervalued companies using either the relative strength index (RSI) or the six-month price index. The former determines whether a company's stock is “overbought” or “oversold.” RSI values of 70 or above suggest possible overvaluation while RSI values of 30 or below suggest possible undervaluation.
Figure 3 illustrates the available RSI filters in the All-in-one Screener.

Figure 3
The price index, on the other hand, highlights the stock's price trend over the past six months. A price index less than 1 indicates the company's share price declined during the six-month period, which can either lead to a value opportunity or a potential value trap depending on the company's profitability.
Simple moving average
The simple moving average gives the arithmetic average of share prices over a specific period. GuruFocus' All-in-one Screener supports screening based on the 20-day SMA, 50-day SMA and 200-day SMA: Users can screen for price % above or % below the SMA as Figure 4 illustrates.

Figure 4
Bollinger Bands
Bollinger Bands extend the simple moving average line to an upper band that is two standard deviations above the 20-day SMA and a lower band that is two standard deviations below the 20-day SMA. Figure 5 illustrates the Screener filters for price to the upper bound Bollinger Band value and price to the lower bound Bollinger Band value.

Figure 5
Momentum indicators
The 6-1 month momentum indicator captures the return of the stock from six months ago to one month ago while the 12-1 month momentum indicator captures the return of the stock from 12 months ago to one month ago. Figure 6 illustrates the Screener filters for the momentum indicators.

Figure 6
New technical indicators added in 2024:
Exponential moving average: The exponential moving average functions like the simple moving average; however, the EMA places higher weight on the most-recent data points. The Screener supports screening based on the price percent above or below the 20-day EMA, 50-day EMA and 200-day EMA.
Golden Cross / Death Cross: A golden cross occurs when a shorter-term moving average crosses above the longer-term moving average during the past week. The Screener supports golden cross patterns for 20-day to 50-day SMA, 20-day to 200-day SMA, 50-day to 200-day SMA, 20-day to 50-day EMA, 20-day to 200-day EMA and 50-day to 200-day EMA.
On the other hand, a death cross occurs when a shorter-term moving average crosses below the longer-term moving average during the past week. The Screener supports death cross patterns for 20-day to 50-day SMA, 20-day to 200-day SMA, 50-day to 200-day SMA, 20-day to 50-day EMA, 20-day to 200-day EMA and 50-day to 200-day EMA.
Figure 7 illustrates the filters for EMA, golden cross and death cross patterns.
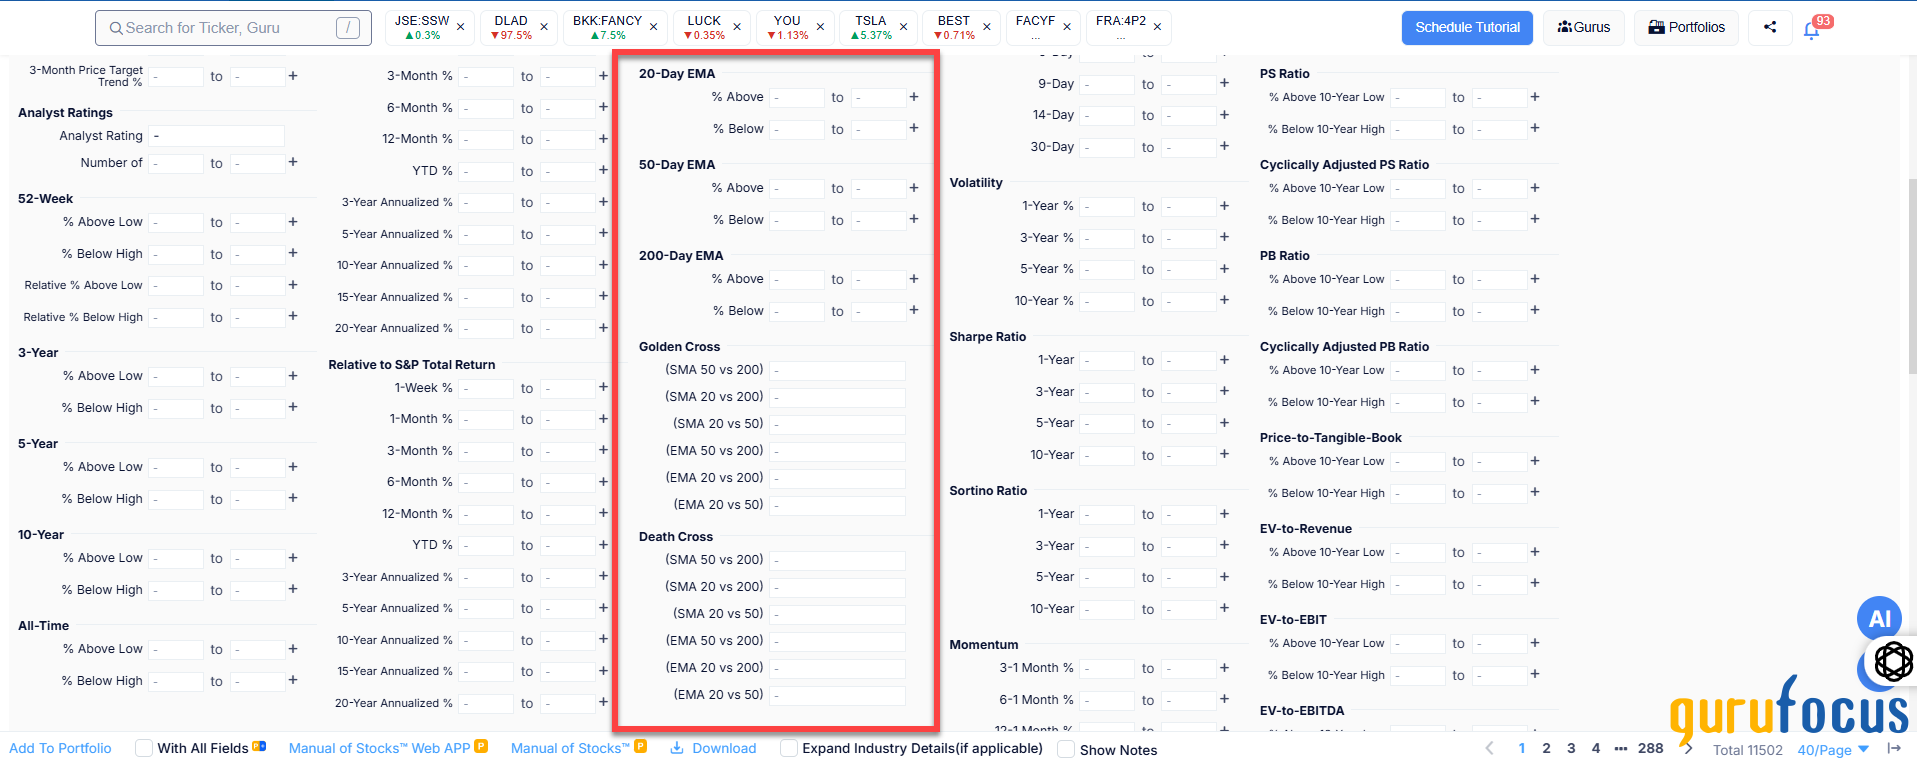
Figure 7
Moving average convergence divergence (MACD)
Gerald Appel developed the moving average convergence divergence (MACD) indicator in the 1970s. MACD captures the difference between the 12-day exponential moving average and the 26-day exponential moving average. The signal line is the nine-day EMA of the MACD line.
The All-in-one Screener supports the following filters:
Crossed Above Signal: The MACD line crossed above the signal line during the past week. (yes or no)
Crossed Below Signal: The MACD line crossed below the signal line during the past week. (yes or no)
Above Signal: Select yes to screen for stocks where the MACD line is currently above the signal line, or no to screen for stocks where the MACD line is currently below the signal line.
Above Zero: Select yes to screen for stocks where the MACD line is positive, or no to screen for stocks where the MACD line is negative.
Figure 8 illustrates the MACD filters available in the Screener.

Figure 8