

In the first three quarters of 2013, the year-to-date return for the stock market benchmark S&P 500 is 18.04%. It gained 2.97% in September, the fourth biggest monthly gain since 2013, after 5.69% in July, 3.36% in March and 3.04% in May. The market reached its second historical high on Aug. 2, 2013. On Sept. 18, 2013, it reached its highest point at 1725.52.
In the Federal Open Market Committee’s (FOMC) September meeting, members of the Federal Reserve’s monetary policy-making body saw financial situations as tighter and a risk from “sizable increases in interest rates.” Most members still anticipated tapering of quantitative easing happening later this year. FOMC forecasted the easing in the effects of fiscal policy restraint on economic growth. Some of the members saw the increasing risk of the fiscal policy. Quoting from the minutes of the FOMC, “Participants continued to project the rate of growth of economic activity to strengthen over coming years, supported by highly accommodative monetary policy and the gradual abatement of the headwinds that have been slowing the pace of economic recovery, such as household-sector deleveraging, tight credit conditions for some households and businesses, and fiscal restraint.”
As investors are happier with the higher balances in their account, they should never forget the word “RISK,” which is directly linked to the valuations of the asset they own. A higher current valuation always implies lower future returns.
GuruFocus hosts three pages about market valuations. The first is the market valuation based on the ratio of total market cap over GDP; the second is the measurement of the U.S. market valuation based on the Shiller P/E. These pages are for the U.S. market. We have also created a new page for international markets. You can check it out here. All pages are updated at least daily. Monthly data is displayed for the international market.
Why Is This Important?
As pointed out by Warren Buffett, the percentage of total market cap (TMC) relative to the U.S. GNP is “probably the best single measure of where valuations stand at any given moment.”
Knowing the overall market valuation and the expected market returns will give investors a clearer head on where we stand for future market returns. When the overall market is expensive and positioned for poor returns, the overall market risk is high. It is important for investors to be aware of this and take consideration of this in their asset allocation and investing strategies.
Please keep in mind that the long-term valuations published here do not predict short-term market movement. But they have done a good job predicting the long-term market returns and risks.
Wise man Howard Marks also pointed out that investors should always know where we are with the market. Predicting the direction of the market is hard. But investors can always make educated decisions based on current conditions.
Howard Marks thinks that “most assets are neither dangerously elevated (with the possible exception of long-term Treasury bonds and high grades) nor compellingly cheap. It’s easier to know what to do at the extremes than it is in the middle ground, where I believe we are today”. He wrote in his latest memo.
Why Did We Develop These Pages?
We developed these pages because of the lessons we learned over the years of value investing. From the market crashes in 2001 to 2002 and 2008 to 2009, we learned that value investors should also keep an eye on overall market valuation. Many times value investors tend to find cheaper stocks in any market. But a lot of times the stocks they found are just cheaper, instead of cheap. Keeping an eye on the overall market valuation will help us to focus on absolute value instead of relative value.
The indicators we develop focus on the long term. They will provide a more objective view on the market.
Ratio of Total Market Cap over GDP - Market Valuation and Implied Returns
The information about the market valuation and the implied return based on the ratio of the total market cap over GDP is updated daily. The total market cap as measured by Wilshire 5000 index is now 112.4% of the US GDP. The stock market is likely to return about 2.1% a year in the coming years. As a comparison, at the beginning of 2013, the ratio of total market cap over GDP was 97.5%, and it was likely to return 4% a year from that level of valuation. The 18.04% gain since the beginning of 2013 has reduced the future gains by about 1.9% a year.
For details, please go to the daily updated page. In general, the returns of investing in an individual stock or in the entire stock market are determined by these three factors:
1. Business Growth
If we look at a particular business, the value of the business is determined by how much money this business can make. The growth in the value of the business comes from the growth of the earnings of the business growth. This growth in the business value is reflected as the price appreciation of the company stock if the market recognizes the value, which it does, eventually.
If we look at the overall economy, the growth in the value of the entire stock market comes from the growth of corporate earnings. As we discussed above, over the long term, corporate earnings grow as fast as the economy itself.
2. Dividends
Dividends are an important portion of the investment return. Dividends come from the cash earning of a business. Everything equal, a higher dividend payout ratio, in principle, should result in a lower growth rate. Therefore, if a company pays out dividends while still growing earnings, the dividend is an additional return for the shareholders besides the appreciation of the business value.
3. Change in the Market Valuation
Although the value of a business does not change overnight, its stock price often does. The market valuation is usually measured by the well-known ratios such as P/E, P/S, P/B, etc. These ratios can be applied to individual businesses, as well as the overall market. The ratio Warren Buffett uses for market valuation, TMC/GNP, is equivalent to the P/S ratio of the economy.
Putting all the three factors together, the return of an investment can be estimated by the following formula:
Investment Return (%) = Dividend Yield (%)+ Business Growth (%)+ Change of Valuation (%)
From the contributions we can get the predicted return of the market.
The Predicted and the Actual Stock Market Returns
This model has done a decent job in predicting the future market returns. You can see the predicted return and the actual return in the chart below.

The prediction from this approach is never an exact number. The return can be as high as 10% a year or as low as -6% a year, depending where the future market valuation will be. In general, investors need to be cautious when the expected return is low.
Shiller P/E - Market Valuation and Implied Returns
The GuruFocus Shiller P/E page indicates that the Shiller P/E is 23.6. This is 43% higher than the historical mean of 16.5. Implied future annual return is 1.9%. As a comparison, the regular trailing 12-month P/E is 19, higher than the historical mean of 15.8. That is also why the media pundits are saying that the market is cheap.
Twelve months ago, Shiller P/E was 21.8, and regular trailing 12-month P/E was around 15. The market did look cheap with trailing 12-month P/E.
The Shiller P/E chart is shown below:
Over the last decade, the Shiller P/E indicated that the best time to buy stocks was March 2009. However, the regular P/E was at its highest level ever. The Shiller P/E, similar to the ratio of the total market cap over GDP, has proven to be a better indication of market valuations.
Overall, the current market valuation is more expensive than the most part of the last 130 years. It is cheaper than most of the time over the last 15 years.
To understand more, please go to GuruFocus' Shiller P/E page.
John Hussman’s Peak P/E:
John Hussman uses the peak P/E ratio to smooth out the distortion of the corporate profits caused by the fluctuations of the profit margins. The current market return projected by his model is less than 2.9% a year.
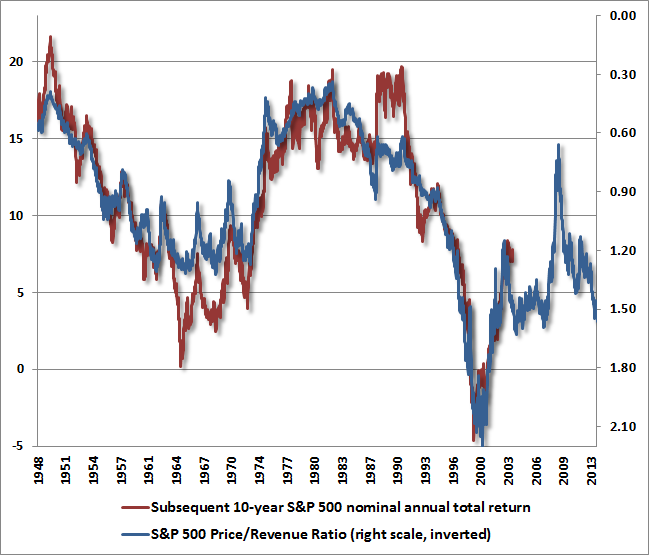
In his commentary on Sept. 23, 2013, Psychological Ether, he estimates a likely total return for the S&P 500 over the coming decade of less than 2.9% annually. He continued to believe that present conditions warrant a generally defensive outlook. “One hardly needs to accept any of these concerns to recognize that current equity valuations are consistent with the likelihood of dismal long-term returns. The historical record of reliable valuation measures should be sufficient. The chart below illustrates the relationship between the S&P 500 price/revenue ratio and subsequent 10-year nominal annual total returns for the S&P 500. ”
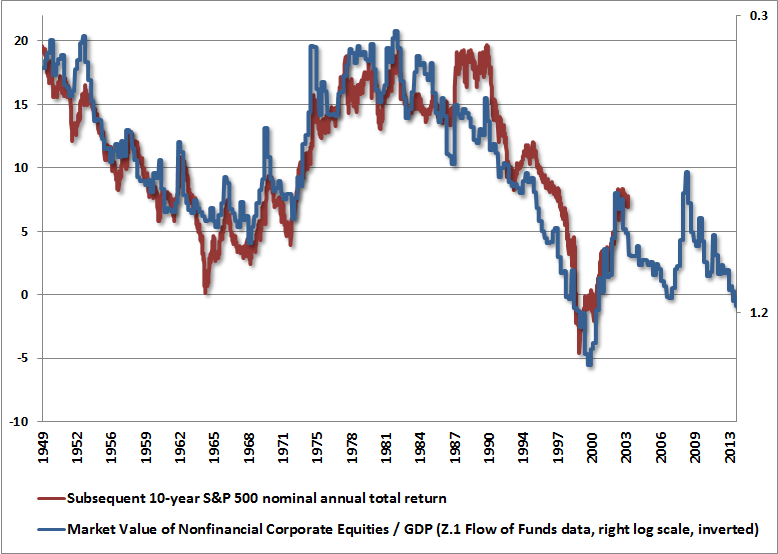
“On that front, the chart below shows the value of nonfinancial corporate equities to GDP (imputed from March to the present based on changes in the S&P 500). On this measure, the likely prospective 10-year nominal total return of the S&P 500 lines up at somewhere less than zero. Suffice it to say that our estimates using both earnings and non-earnings based measures suggest a likely total return for the S&P 500 over the coming decade of less than 2.9% annually, essentially driven by dividend income, and implying an S&P 500 that is roughly unchanged a decade from now – though undoubtedly comprising a volatile set of market cycles on that course to nowhere.”
This agrees with the returns projected by the ratio of total market cap over GDP and Shiller P/E.
In all the three approaches discussed above, the fluctuations of profit margin are eliminated by using GDP, the average of trailing 10-year inflation-adjusted earnings, and peak-P/E, revenue or book value, etc. Therefore they arrive at similar conclusions: The market is overvalued, and it is likely to return only 1.9% to 2.9% a year in the future years.
Jeremy Grantham’s 7-Year Projection:
Jeremy Grantham’s firm GMO publishes a monthly seven-year market forecast. According to Ben Inker and James Montier’s quarterly letter What the *&%! Just Happened? and The Purgatory of Low Returns, it noted that today’s opportunity set is characterized by almost everything being expensive. James Montier believes this is a direct effect of the quantitative easing policies being pursued by the Federal Reserve and their ilk around the world. James Montier advises that investors should “be patient” at this point.
As of September 30, 2013, GMO’s 7-year forecast is below:
Source: https://www.gmo.com/America/CMSAttachmentDownload.aspx?target=JUBRxi51IIBDVLb6g8lbKzC5OTwNJieJnCFo6Pc6gcycSMDOY9x9jmayrwKaLIb2T6S86QFct8frDP182Q%2byfbzxzid6ANHmgREvMBV7oKc%3d
GMO expected that the U.S. large cap real return is -2.0%. This number does not agree with what we find out with market/GDP ratio and Shiller P/E ratio. The U.S. high quality’s return is expected to be 3.3% a year.
Insider Trends
As indicated by the three different approaches discussed above, the best buying opportunities over the last five years appeared when the projected returns were at their highest level from October 2008 to April 2009, when investors could expect 10% a year from the U.S. market.
If average investors missed this opportunity, corporate insiders such as CEOs, CFOs and directors did not. As a whole they purchased their own company shares at more than double the normal rate from October 2008 to April 2009. Many of these purchases resulted in multi-bagger gains. This confirmed again the conclusions of earlier studies: The aggregated activities of insiders can serve as a good indicator for locating the market bottoms. Insiders as a whole are smart investors of their own companies. They tend to sell more when the market is high, and buy more when the market is low.
This is the current insider trend for S&P 500 companies:

The latest trends of insider buying are updated daily at GuruFocus' Insider Trend page. Data is updated hourly on this page. The insider trends of different sectors are also displayed in this page. The latest insider buying peak is at this page: September of 2011, when the market was at recent lows.
Conclusion: The stock market is not cheap as measured by long-term valuation ratios. It is positioned for about 1.9% to 2.9% of annual returns for the next decade. By watching the overall market valuations and the insider buying trends investors will have a better understanding of the risk and the opportunities. The best time to buy is when the market valuation is low and insiders are enthusiastic about their own company's stocks.
Investment Strategies at Different Market Levels
The Shiller P/E and the ratio of total market cap over GDP can serve as good guidance for investors in deciding their investment strategies at different market valuations. Historical market returns prove that when the market is fair or overvalued, it pays to be defensive. Companies with high-quality business and strong balance sheet will provide better returns in this environment. When the market is cheap, beaten down companies with strong balance sheets can provide outsized returns.
To Summarize:
1. When the market is fair valued or overvalued, buy high-quality companies such as those in the Buffett-Munger Screener.
2. When the market is undervalued, buy low-risk beaten-down companies like those in the Ben Graham Net-Net Screener. Buy a basket of them and be diversified.
3. If market is way over valued, stay in cash. You may consider hedging or short.
If you are not a Premium Member, we invite you for a 7-day Free Trial.
In the Federal Open Market Committee’s (FOMC) September meeting, members of the Federal Reserve’s monetary policy-making body saw financial situations as tighter and a risk from “sizable increases in interest rates.” Most members still anticipated tapering of quantitative easing happening later this year. FOMC forecasted the easing in the effects of fiscal policy restraint on economic growth. Some of the members saw the increasing risk of the fiscal policy. Quoting from the minutes of the FOMC, “Participants continued to project the rate of growth of economic activity to strengthen over coming years, supported by highly accommodative monetary policy and the gradual abatement of the headwinds that have been slowing the pace of economic recovery, such as household-sector deleveraging, tight credit conditions for some households and businesses, and fiscal restraint.”
As investors are happier with the higher balances in their account, they should never forget the word “RISK,” which is directly linked to the valuations of the asset they own. A higher current valuation always implies lower future returns.
GuruFocus hosts three pages about market valuations. The first is the market valuation based on the ratio of total market cap over GDP; the second is the measurement of the U.S. market valuation based on the Shiller P/E. These pages are for the U.S. market. We have also created a new page for international markets. You can check it out here. All pages are updated at least daily. Monthly data is displayed for the international market.
Why Is This Important?
As pointed out by Warren Buffett, the percentage of total market cap (TMC) relative to the U.S. GNP is “probably the best single measure of where valuations stand at any given moment.”
Knowing the overall market valuation and the expected market returns will give investors a clearer head on where we stand for future market returns. When the overall market is expensive and positioned for poor returns, the overall market risk is high. It is important for investors to be aware of this and take consideration of this in their asset allocation and investing strategies.
Please keep in mind that the long-term valuations published here do not predict short-term market movement. But they have done a good job predicting the long-term market returns and risks.
Wise man Howard Marks also pointed out that investors should always know where we are with the market. Predicting the direction of the market is hard. But investors can always make educated decisions based on current conditions.
Howard Marks thinks that “most assets are neither dangerously elevated (with the possible exception of long-term Treasury bonds and high grades) nor compellingly cheap. It’s easier to know what to do at the extremes than it is in the middle ground, where I believe we are today”. He wrote in his latest memo.
Why Did We Develop These Pages?
We developed these pages because of the lessons we learned over the years of value investing. From the market crashes in 2001 to 2002 and 2008 to 2009, we learned that value investors should also keep an eye on overall market valuation. Many times value investors tend to find cheaper stocks in any market. But a lot of times the stocks they found are just cheaper, instead of cheap. Keeping an eye on the overall market valuation will help us to focus on absolute value instead of relative value.
The indicators we develop focus on the long term. They will provide a more objective view on the market.
Ratio of Total Market Cap over GDP - Market Valuation and Implied Returns
The information about the market valuation and the implied return based on the ratio of the total market cap over GDP is updated daily. The total market cap as measured by Wilshire 5000 index is now 112.4% of the US GDP. The stock market is likely to return about 2.1% a year in the coming years. As a comparison, at the beginning of 2013, the ratio of total market cap over GDP was 97.5%, and it was likely to return 4% a year from that level of valuation. The 18.04% gain since the beginning of 2013 has reduced the future gains by about 1.9% a year.
For details, please go to the daily updated page. In general, the returns of investing in an individual stock or in the entire stock market are determined by these three factors:
1. Business Growth
If we look at a particular business, the value of the business is determined by how much money this business can make. The growth in the value of the business comes from the growth of the earnings of the business growth. This growth in the business value is reflected as the price appreciation of the company stock if the market recognizes the value, which it does, eventually.
If we look at the overall economy, the growth in the value of the entire stock market comes from the growth of corporate earnings. As we discussed above, over the long term, corporate earnings grow as fast as the economy itself.
2. Dividends
Dividends are an important portion of the investment return. Dividends come from the cash earning of a business. Everything equal, a higher dividend payout ratio, in principle, should result in a lower growth rate. Therefore, if a company pays out dividends while still growing earnings, the dividend is an additional return for the shareholders besides the appreciation of the business value.
3. Change in the Market Valuation
Although the value of a business does not change overnight, its stock price often does. The market valuation is usually measured by the well-known ratios such as P/E, P/S, P/B, etc. These ratios can be applied to individual businesses, as well as the overall market. The ratio Warren Buffett uses for market valuation, TMC/GNP, is equivalent to the P/S ratio of the economy.
Putting all the three factors together, the return of an investment can be estimated by the following formula:
Investment Return (%) = Dividend Yield (%)+ Business Growth (%)+ Change of Valuation (%)
From the contributions we can get the predicted return of the market.
The Predicted and the Actual Stock Market Returns
This model has done a decent job in predicting the future market returns. You can see the predicted return and the actual return in the chart below.
The prediction from this approach is never an exact number. The return can be as high as 10% a year or as low as -6% a year, depending where the future market valuation will be. In general, investors need to be cautious when the expected return is low.
Shiller P/E - Market Valuation and Implied Returns
The GuruFocus Shiller P/E page indicates that the Shiller P/E is 23.6. This is 43% higher than the historical mean of 16.5. Implied future annual return is 1.9%. As a comparison, the regular trailing 12-month P/E is 19, higher than the historical mean of 15.8. That is also why the media pundits are saying that the market is cheap.
Twelve months ago, Shiller P/E was 21.8, and regular trailing 12-month P/E was around 15. The market did look cheap with trailing 12-month P/E.
The Shiller P/E chart is shown below:
Over the last decade, the Shiller P/E indicated that the best time to buy stocks was March 2009. However, the regular P/E was at its highest level ever. The Shiller P/E, similar to the ratio of the total market cap over GDP, has proven to be a better indication of market valuations.
Overall, the current market valuation is more expensive than the most part of the last 130 years. It is cheaper than most of the time over the last 15 years.
To understand more, please go to GuruFocus' Shiller P/E page.
John Hussman’s Peak P/E:
John Hussman uses the peak P/E ratio to smooth out the distortion of the corporate profits caused by the fluctuations of the profit margins. The current market return projected by his model is less than 2.9% a year.
In his commentary on Sept. 23, 2013, Psychological Ether, he estimates a likely total return for the S&P 500 over the coming decade of less than 2.9% annually. He continued to believe that present conditions warrant a generally defensive outlook. “One hardly needs to accept any of these concerns to recognize that current equity valuations are consistent with the likelihood of dismal long-term returns. The historical record of reliable valuation measures should be sufficient. The chart below illustrates the relationship between the S&P 500 price/revenue ratio and subsequent 10-year nominal annual total returns for the S&P 500. ”
“On that front, the chart below shows the value of nonfinancial corporate equities to GDP (imputed from March to the present based on changes in the S&P 500). On this measure, the likely prospective 10-year nominal total return of the S&P 500 lines up at somewhere less than zero. Suffice it to say that our estimates using both earnings and non-earnings based measures suggest a likely total return for the S&P 500 over the coming decade of less than 2.9% annually, essentially driven by dividend income, and implying an S&P 500 that is roughly unchanged a decade from now – though undoubtedly comprising a volatile set of market cycles on that course to nowhere.”
This agrees with the returns projected by the ratio of total market cap over GDP and Shiller P/E.
In all the three approaches discussed above, the fluctuations of profit margin are eliminated by using GDP, the average of trailing 10-year inflation-adjusted earnings, and peak-P/E, revenue or book value, etc. Therefore they arrive at similar conclusions: The market is overvalued, and it is likely to return only 1.9% to 2.9% a year in the future years.
Jeremy Grantham’s 7-Year Projection:
Jeremy Grantham’s firm GMO publishes a monthly seven-year market forecast. According to Ben Inker and James Montier’s quarterly letter What the *&%! Just Happened? and The Purgatory of Low Returns, it noted that today’s opportunity set is characterized by almost everything being expensive. James Montier believes this is a direct effect of the quantitative easing policies being pursued by the Federal Reserve and their ilk around the world. James Montier advises that investors should “be patient” at this point.
As of September 30, 2013, GMO’s 7-year forecast is below:
| Stocks | |||
| US Large | -2.0% | Intl Large | 1.9% |
| US Small | -3.8% | Intl Small | 1.6% |
| US High Quality | 3.3% | Emerging | 6.5% |
| Bonds | |||
| US Bonds | 0.3% | Inflation Linked Bonds | 0.3% |
| Intl Bonds Hedged | -2.0% | Cash | -0.4% |
| Emerging Debt | 2.7% | ||
| Other | |||
| Timber | 5.9% |
GMO expected that the U.S. large cap real return is -2.0%. This number does not agree with what we find out with market/GDP ratio and Shiller P/E ratio. The U.S. high quality’s return is expected to be 3.3% a year.
Insider Trends
As indicated by the three different approaches discussed above, the best buying opportunities over the last five years appeared when the projected returns were at their highest level from October 2008 to April 2009, when investors could expect 10% a year from the U.S. market.
If average investors missed this opportunity, corporate insiders such as CEOs, CFOs and directors did not. As a whole they purchased their own company shares at more than double the normal rate from October 2008 to April 2009. Many of these purchases resulted in multi-bagger gains. This confirmed again the conclusions of earlier studies: The aggregated activities of insiders can serve as a good indicator for locating the market bottoms. Insiders as a whole are smart investors of their own companies. They tend to sell more when the market is high, and buy more when the market is low.
This is the current insider trend for S&P 500 companies:
The latest trends of insider buying are updated daily at GuruFocus' Insider Trend page. Data is updated hourly on this page. The insider trends of different sectors are also displayed in this page. The latest insider buying peak is at this page: September of 2011, when the market was at recent lows.
Conclusion: The stock market is not cheap as measured by long-term valuation ratios. It is positioned for about 1.9% to 2.9% of annual returns for the next decade. By watching the overall market valuations and the insider buying trends investors will have a better understanding of the risk and the opportunities. The best time to buy is when the market valuation is low and insiders are enthusiastic about their own company's stocks.
Investment Strategies at Different Market Levels
The Shiller P/E and the ratio of total market cap over GDP can serve as good guidance for investors in deciding their investment strategies at different market valuations. Historical market returns prove that when the market is fair or overvalued, it pays to be defensive. Companies with high-quality business and strong balance sheet will provide better returns in this environment. When the market is cheap, beaten down companies with strong balance sheets can provide outsized returns.
To Summarize:
1. When the market is fair valued or overvalued, buy high-quality companies such as those in the Buffett-Munger Screener.
2. When the market is undervalued, buy low-risk beaten-down companies like those in the Ben Graham Net-Net Screener. Buy a basket of them and be diversified.
3. If market is way over valued, stay in cash. You may consider hedging or short.
If you are not a Premium Member, we invite you for a 7-day Free Trial.