

From Oct. 1 through Oct. 16, 2013, the U.S. federal government entered a shutdown. It seems the government shutdown did not affect the stock market a lot. The later released economic data is stronger than expected. Equity investors seem to be persuaded by the Federal Reserve with the idea that QE tapering is not tightening.
Up to Dec. 2, 2013, the year-to-date return for the stock market benchmark S&P 500 since 2013 is 23.15%. It gained 2.23% in November. The stock market went up higher and higher continually, and then hit the historical record high at 1807.23 on Nov. 27, 2013.
As investors are happier with the higher balances in their account, they should never forget the word “RISK,” which is directly linked to the valuations of the asset they own. A higher current valuation always implies a lower future return.
In GMO's third quarter letter, Ben Inker used “Breaking News! U.S. Equity Market Overvalued!” as the title. In John Hussman’s commentary on Nov. 4, 2013, “Leash the Dogma,” he said he believed there is a largely unrecognized bubble in stock price. Wise man Howard Marks also pointed out that China’s equities are “tremendous bargains” while U.S. stocks are “fairly to fully valued”in Shanghai on Nov. 4, 2013. By contrast, Warren Buffett said on Nov. 19, 2013, “I would say that they're in a zone of reasonableness.” So where are we in the market? Will the future returns decline?
GuruFocus hosts three pages about market valuations. The first is the market valuation based on the ratio of total market cap over GDP; the second is the measurement of the U.S. market valuation based on the Shiller P/E. These pages are for the U.S. market. We have also created a new page for international markets. You can check it out here. All pages are updated at least daily. Monthly data is displayed for the international market.
Why Is This Important?
As pointed out by Warren Buffett, the percentage of total market cap (TMC) relative to the U.S. GNP is “probably the best single measure of where valuations stand at any given moment.”
Knowing the overall market valuation and the expected market returns will give investors a clearer head on where we stand for future market returns. When the overall market is expensive and positioned for poor returns, the overall market risk is high. It is important for investors to be aware of this and take consideration of this in their asset allocation and investing strategies.
Please keep in mind that the long-term valuations published here do not predict short-term market movement. But they have done a good job predicting the long-term market returns and risks.
Why Did We Develop These Pages?
We developed these pages because of the lessons we learned over the years of value investing. From the market crashes in 2001 to 2002 and 2008 to 2009, we learned that value investors should also keep an eye on overall market valuation. Many times value investors tend to find cheaper stocks in any market. But a lot of times the stocks they found are just cheaper, instead of cheap. Keeping an eye on the overall market valuation will help us to focus on absolute value instead of relative value.
The indicators we develop focus on the long term. They will provide a more objective view on the market.
Ratio of Total Market Cap over GDP - Market Valuation and Implied Returns
The information about the market valuation and the implied return based on the ratio of the total market cap over GDP is updated daily. The total market cap as measured by Wilshire 5000 index is now 113.5% of the U.S. GDP. The stock market is likely to return about 2% a year in the coming years. The stock market is modestly overvalued. As a comparison, at the beginning of 2013, the ratio of total market cap over GDP was 97.5%, and it was likely to return 4% a year from that level of valuation. The 23.15% gain since the beginning of 2013 has reduced the future gains by about 2% a year.
For details, please go to the daily updated page. In general, the returns of investing in an individual stock or in the entire stock market are determined by these three factors:
1. Business growth
If we look at a particular business, the value of the business is determined by how much money this business can make. The growth in the value of the business comes from the growth of the earnings of the business growth. This growth in the business value is reflected as the price appreciation of the company stock if the market recognizes the value, which it does, eventually.
If we look at the overall economy, the growth in the value of the entire stock market comes from the growth of corporate earnings. As we discussed above, over the long term, corporate earnings grow as fast as the economy itself.
2. Dividends
Dividends are an important portion of the investment return. Dividends come from the cash earning of a business. Everything equal, a higher dividend payout ratio, in principle, should result in a lower growth rate. Therefore, if a company pays out dividends while still growing earnings, the dividend is an additional return for the shareholders besides the appreciation of the business value.
3. Change in the market valuation
Although the value of a business does not change overnight, its stock price often does. The market valuation is usually measured by the well-known ratios such as P/E, P/S, P/B, etc. These ratios can be applied to individual businesses, as well as the overall market. The ratio Warren Buffett uses for market valuation, TMC/GNP, is equivalent to the P/S ratio of the economy.
Putting all the three factors together, the return of an investment can be estimated by the following formula:
Investment Return (%) = Dividend Yield (%)+ Business Growth (%)+ Change of Valuation (%)
From the contributions we can get the predicted return of the market.
The Predicted and the Actual Stock Market Returns
This model has done a decent job in predicting the future market returns. You can see the predicted return and the actual return in the chart below.

The prediction from this approach is never an exact number. The return can be as high as 7% a year or as low as -6% a year, depending where the future market valuation will be. In general, investors need to be cautious when the expected return is low.
Shiller P/E - Market Valuation and Implied Returns
The GuruFocus Shiller P/E page indicates that the Shiller P/E is 25.2. This is 52.7% higher than the historical mean of 16.5. Implied future annual return is 1.1%. As a comparison, the regular trailing 12-month P/E is 20, higher than the historical mean of 15.8. That is also why the media pundits are saying that the market is cheap.
Twelve months ago, Shiller P/E was 21.8, and regular trailing twelve month P/E was around 15. The market did look cheap with trailing twelve month P/E.
The Shiller P/E chart is shown below:
Over the last decade, the Shiller P/E indicated that the best time to buy stocks was March 2009. However, the regular P/E was at its highest level ever. The Shiller P/E, similar to the ratio of the total market cap over GDP, has proven to be a better indication of market valuations.
Overall, the current market valuation is more expensive than the most part of the last 130 years. It is cheaper than most of the time over the last 15 years.
To understand more, please go to GuruFocus' Shiller P/E page.
John Hussman’s Peak P/E:
John Hussman uses the peak P/E ratio to smooth out the distortion of the corporate profits caused by the fluctuations of the profit margins. He presently estimates a nominal annual total return for the S&P 500 over the coming decade somewhere between zero and 2.2%.
In his commentary on Dec. 2, 2013, “The Elephant in the Room,” he said, “We are observing overvalued, overbought, overbullish extremes that are uniquely associated with peaks that preceded the worst market losses in history (including 1929, 1972, 1987, 2000 and 2007). Speculators are now leveraged to the greatest extent in history, with NYSE margin debt surging last month to a record high in dollar terms, and 2.5% of GDP in relative terms (a level previously observed only at the 2000 and 2007 extremes).” He believed that “more than half, and perhaps closer to all, of the market’s gains since 2009 will be surrendered over the completion of this cycle. Investors will do themselves terrible harm if they ignore the objective warnings of history based on our subjective experience in this unfinished half-cycle. That subjective experience is far more closely related to my 2009 stress-testing decision than many investors recognize.”
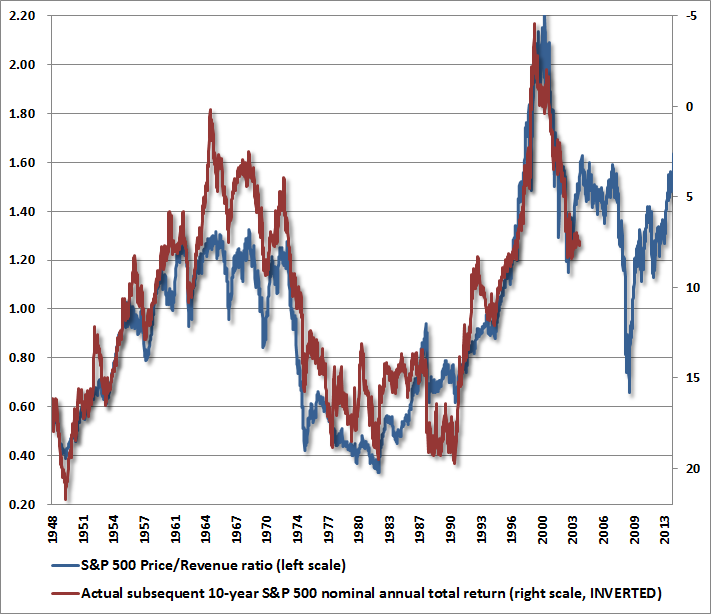
In his commentary on Nov. 25, 2013, “An Open Letter to the FOMC: Recognizing the Valuation Bubble In Equities,” the chart below shows the S&P 500 price/revenue ratio (left scale) versus the actual subsequent 10-year nominal total return of the S&P 500 over the following decade (right scale, inverted). He believed “Market valuations on this measure are well above any point prior to the late-1990s market bubble. Indeed, if one examines the stocks in the S&P 500 individually, the median price/revenue multiple is actually higher today than it was in 2000 (smaller stocks were more reasonably valued in 2000, compared with the present). This is a dangerous situation. In this context, the dismissive view of FOMC officials regarding equity overvaluation appears misplaced, and seems likely to be followed by disruptive financial adjustments.”
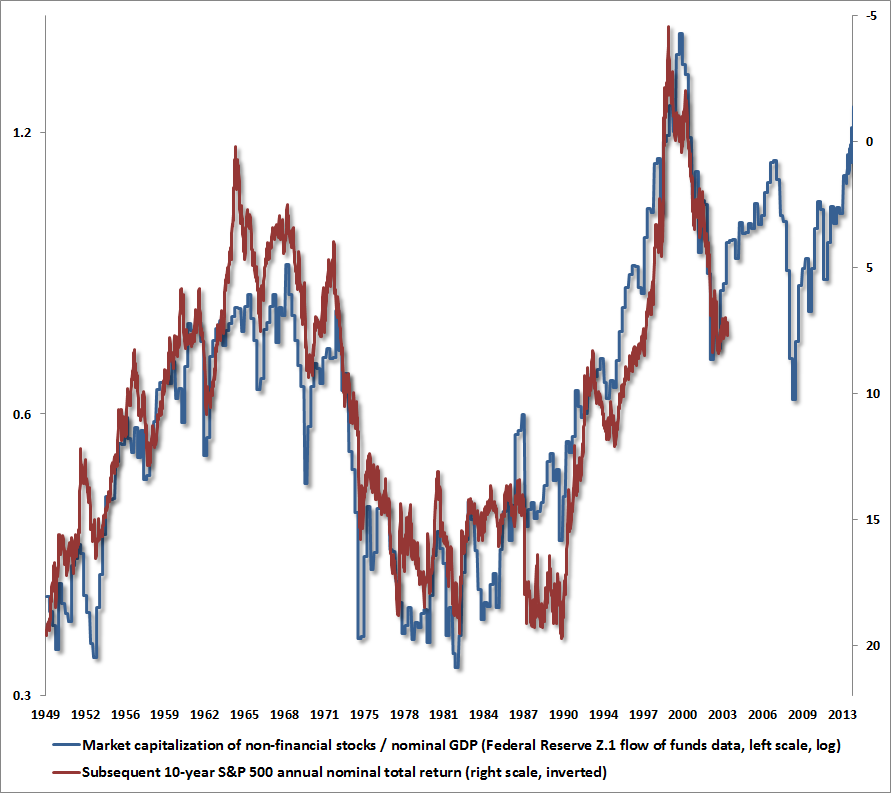
According to John Hussman, another measure using “smooth” fundamentals is the ratio of stock market capitalization to nominal GDP, based on Federal Reserve Z.1 Flow of Funds data. “On this measure, equities are already beyond their 2007 peak valuations, and are approaching the 2000 extreme. The associated 10-year expected nominal total return for the S&P 500 is negative.”
In all the three approaches discussed above, the fluctuations of profit margin are eliminated by using GDP, the average of trailing 10-year inflation-adjusted earnings, and peak-P/E, revenue or book value, etc. Therefore they arrive at similar conclusions: The market is overvalued, and it is likely to return only 0 to 2.2% annually in future years.
Jeremy Grantham’s 7-Year Projection:
Jeremy Grantham’s firm GMO publishes a monthly 7-year market forecast. According to Ben Inker and James Montier’s 3Q letter Breaking News! U.S. Equity Market Overvalued! and Ignoble Prizes and Appointments, Jeremy Grantham believed “investors should be aware that the U.S. market is already badly overpriced – indeed, we believe it is priced to deliver negative real returns over seven years [GMO estimates fair value for the S&P 500 at 1100]. In our view, prudent investors should already be reducing their equity bets and their risk level in general. One of the more painful lessons in investing is that the prudent investor (or “value investor” if you prefer) almost invariably must forego plenty of fun at the top end of markets. This market is already no exception, but speculation can hurt prudence much more and probably will. Be prudent and you’ll probably forego gains. Be risky and you’ll probably make some more money, but you may be bushwhacked and if you are, your excuses will look thin. My personal view is that the path of least resistance for the market will be up.”
As of Oct. 31, 2013, GMO’s 7-year forecast is below:
Source:
https://www.gmo.com/America/CMSAttachmentDownload.aspx?target=JUBRxi51IICANcPenAXxYNaG5zSjYT78FgY%2fS2%2bHjHUU8Ll53xvryAM2c8B5Y8DXs9qeifx44r3MYbjhGGWvmYUD4VhpZBu6Xc3qBBAbdBk%3d
GMO's expected U.S. large cap real return is -1.3%. This number does not agree with what we find out with the market/GDP ratio and Shiller P/E ratio. The U.S. high quality’s return is expected to be 2.7% a year.
Insider Trends
As indicated by the three different approaches discussed above, the best buying opportunities over the last five years appeared when the projected returns were at their highest level from October 2008 to April 2009, when investors could expect 10% a year from the U.S. market.
If average investors missed this opportunity, corporate insiders such as CEOs, CFOs and directors did not. As a whole they purchased their own company shares at more than double the normal rate from October 2008 to April 2009. Many of these purchases resulted in multi-bagger gains. This confirmed again the conclusions of earlier studies: The aggregated activities of insiders can serve as a good indicator for locating the market bottoms. Insiders as a whole are smart investors of their own companies. They tend to sell more when the market is high, and buy more when the market is low.
This is the current insider trend for S&P 500 companies:

The latest trends of insider buying are updated daily at GuruFocus' Insider Trend page. Data is updated hourly on this page. The insider trends of different sectors are also displayed in this page. The latest insider buying peak is at this page: September of 2011, when the market was at recent lows.
Conclusion: The stock market is not cheap as measured by long term valuation ratios. It is positioned for about 0 to 2.2% of annual returns for the next decade. By watching the overall market valuations and the insider buying trends investors will have a better understanding of the risk and the opportunities. The best time to buy is when the market valuation is low, and insiders are enthusiastic about their own company's stocks.
Investment Strategies at Different Market Levels
The Shiller P/E and the ratio of total market cap over GDP can serve as good guidance for investors in deciding their investment strategies at different market valuations. Historical market returns prove that when the market is fair or overvalued, it pays to be defensive. Companies with a high quality business and strong balance sheet will provide better returns in this environment. When the market is cheap, beaten down companies with strong balance sheets can provide outsized returns.
To summarize:
1. When the market is fair valued or overvalued, buy high-quality companies such as those in the Buffett-Munger Screener.
2. When the market is undervalued, buy low-risk beaten-down companies like those in the Ben Graham Net-Net Screener. Buy a basket of them and be diversified.
3. If market is way over valued, stay in cash. You may consider hedging or short.
If you are not a Premium Member, we invite you for a 7-day Free Trial.
Also check out:
Up to Dec. 2, 2013, the year-to-date return for the stock market benchmark S&P 500 since 2013 is 23.15%. It gained 2.23% in November. The stock market went up higher and higher continually, and then hit the historical record high at 1807.23 on Nov. 27, 2013.
As investors are happier with the higher balances in their account, they should never forget the word “RISK,” which is directly linked to the valuations of the asset they own. A higher current valuation always implies a lower future return.
In GMO's third quarter letter, Ben Inker used “Breaking News! U.S. Equity Market Overvalued!” as the title. In John Hussman’s commentary on Nov. 4, 2013, “Leash the Dogma,” he said he believed there is a largely unrecognized bubble in stock price. Wise man Howard Marks also pointed out that China’s equities are “tremendous bargains” while U.S. stocks are “fairly to fully valued”in Shanghai on Nov. 4, 2013. By contrast, Warren Buffett said on Nov. 19, 2013, “I would say that they're in a zone of reasonableness.” So where are we in the market? Will the future returns decline?
GuruFocus hosts three pages about market valuations. The first is the market valuation based on the ratio of total market cap over GDP; the second is the measurement of the U.S. market valuation based on the Shiller P/E. These pages are for the U.S. market. We have also created a new page for international markets. You can check it out here. All pages are updated at least daily. Monthly data is displayed for the international market.
Why Is This Important?
As pointed out by Warren Buffett, the percentage of total market cap (TMC) relative to the U.S. GNP is “probably the best single measure of where valuations stand at any given moment.”
Knowing the overall market valuation and the expected market returns will give investors a clearer head on where we stand for future market returns. When the overall market is expensive and positioned for poor returns, the overall market risk is high. It is important for investors to be aware of this and take consideration of this in their asset allocation and investing strategies.
Please keep in mind that the long-term valuations published here do not predict short-term market movement. But they have done a good job predicting the long-term market returns and risks.
Why Did We Develop These Pages?
We developed these pages because of the lessons we learned over the years of value investing. From the market crashes in 2001 to 2002 and 2008 to 2009, we learned that value investors should also keep an eye on overall market valuation. Many times value investors tend to find cheaper stocks in any market. But a lot of times the stocks they found are just cheaper, instead of cheap. Keeping an eye on the overall market valuation will help us to focus on absolute value instead of relative value.
The indicators we develop focus on the long term. They will provide a more objective view on the market.
Ratio of Total Market Cap over GDP - Market Valuation and Implied Returns
The information about the market valuation and the implied return based on the ratio of the total market cap over GDP is updated daily. The total market cap as measured by Wilshire 5000 index is now 113.5% of the U.S. GDP. The stock market is likely to return about 2% a year in the coming years. The stock market is modestly overvalued. As a comparison, at the beginning of 2013, the ratio of total market cap over GDP was 97.5%, and it was likely to return 4% a year from that level of valuation. The 23.15% gain since the beginning of 2013 has reduced the future gains by about 2% a year.
For details, please go to the daily updated page. In general, the returns of investing in an individual stock or in the entire stock market are determined by these three factors:
1. Business growth
If we look at a particular business, the value of the business is determined by how much money this business can make. The growth in the value of the business comes from the growth of the earnings of the business growth. This growth in the business value is reflected as the price appreciation of the company stock if the market recognizes the value, which it does, eventually.
If we look at the overall economy, the growth in the value of the entire stock market comes from the growth of corporate earnings. As we discussed above, over the long term, corporate earnings grow as fast as the economy itself.
2. Dividends
Dividends are an important portion of the investment return. Dividends come from the cash earning of a business. Everything equal, a higher dividend payout ratio, in principle, should result in a lower growth rate. Therefore, if a company pays out dividends while still growing earnings, the dividend is an additional return for the shareholders besides the appreciation of the business value.
3. Change in the market valuation
Although the value of a business does not change overnight, its stock price often does. The market valuation is usually measured by the well-known ratios such as P/E, P/S, P/B, etc. These ratios can be applied to individual businesses, as well as the overall market. The ratio Warren Buffett uses for market valuation, TMC/GNP, is equivalent to the P/S ratio of the economy.
Putting all the three factors together, the return of an investment can be estimated by the following formula:
Investment Return (%) = Dividend Yield (%)+ Business Growth (%)+ Change of Valuation (%)
From the contributions we can get the predicted return of the market.
The Predicted and the Actual Stock Market Returns
This model has done a decent job in predicting the future market returns. You can see the predicted return and the actual return in the chart below.
The prediction from this approach is never an exact number. The return can be as high as 7% a year or as low as -6% a year, depending where the future market valuation will be. In general, investors need to be cautious when the expected return is low.
Shiller P/E - Market Valuation and Implied Returns
The GuruFocus Shiller P/E page indicates that the Shiller P/E is 25.2. This is 52.7% higher than the historical mean of 16.5. Implied future annual return is 1.1%. As a comparison, the regular trailing 12-month P/E is 20, higher than the historical mean of 15.8. That is also why the media pundits are saying that the market is cheap.
Twelve months ago, Shiller P/E was 21.8, and regular trailing twelve month P/E was around 15. The market did look cheap with trailing twelve month P/E.
The Shiller P/E chart is shown below:
Over the last decade, the Shiller P/E indicated that the best time to buy stocks was March 2009. However, the regular P/E was at its highest level ever. The Shiller P/E, similar to the ratio of the total market cap over GDP, has proven to be a better indication of market valuations.
Overall, the current market valuation is more expensive than the most part of the last 130 years. It is cheaper than most of the time over the last 15 years.
To understand more, please go to GuruFocus' Shiller P/E page.
John Hussman’s Peak P/E:
John Hussman uses the peak P/E ratio to smooth out the distortion of the corporate profits caused by the fluctuations of the profit margins. He presently estimates a nominal annual total return for the S&P 500 over the coming decade somewhere between zero and 2.2%.
In his commentary on Dec. 2, 2013, “The Elephant in the Room,” he said, “We are observing overvalued, overbought, overbullish extremes that are uniquely associated with peaks that preceded the worst market losses in history (including 1929, 1972, 1987, 2000 and 2007). Speculators are now leveraged to the greatest extent in history, with NYSE margin debt surging last month to a record high in dollar terms, and 2.5% of GDP in relative terms (a level previously observed only at the 2000 and 2007 extremes).” He believed that “more than half, and perhaps closer to all, of the market’s gains since 2009 will be surrendered over the completion of this cycle. Investors will do themselves terrible harm if they ignore the objective warnings of history based on our subjective experience in this unfinished half-cycle. That subjective experience is far more closely related to my 2009 stress-testing decision than many investors recognize.”
In his commentary on Nov. 25, 2013, “An Open Letter to the FOMC: Recognizing the Valuation Bubble In Equities,” the chart below shows the S&P 500 price/revenue ratio (left scale) versus the actual subsequent 10-year nominal total return of the S&P 500 over the following decade (right scale, inverted). He believed “Market valuations on this measure are well above any point prior to the late-1990s market bubble. Indeed, if one examines the stocks in the S&P 500 individually, the median price/revenue multiple is actually higher today than it was in 2000 (smaller stocks were more reasonably valued in 2000, compared with the present). This is a dangerous situation. In this context, the dismissive view of FOMC officials regarding equity overvaluation appears misplaced, and seems likely to be followed by disruptive financial adjustments.”
According to John Hussman, another measure using “smooth” fundamentals is the ratio of stock market capitalization to nominal GDP, based on Federal Reserve Z.1 Flow of Funds data. “On this measure, equities are already beyond their 2007 peak valuations, and are approaching the 2000 extreme. The associated 10-year expected nominal total return for the S&P 500 is negative.”
In all the three approaches discussed above, the fluctuations of profit margin are eliminated by using GDP, the average of trailing 10-year inflation-adjusted earnings, and peak-P/E, revenue or book value, etc. Therefore they arrive at similar conclusions: The market is overvalued, and it is likely to return only 0 to 2.2% annually in future years.
Jeremy Grantham’s 7-Year Projection:
Jeremy Grantham’s firm GMO publishes a monthly 7-year market forecast. According to Ben Inker and James Montier’s 3Q letter Breaking News! U.S. Equity Market Overvalued! and Ignoble Prizes and Appointments, Jeremy Grantham believed “investors should be aware that the U.S. market is already badly overpriced – indeed, we believe it is priced to deliver negative real returns over seven years [GMO estimates fair value for the S&P 500 at 1100]. In our view, prudent investors should already be reducing their equity bets and their risk level in general. One of the more painful lessons in investing is that the prudent investor (or “value investor” if you prefer) almost invariably must forego plenty of fun at the top end of markets. This market is already no exception, but speculation can hurt prudence much more and probably will. Be prudent and you’ll probably forego gains. Be risky and you’ll probably make some more money, but you may be bushwhacked and if you are, your excuses will look thin. My personal view is that the path of least resistance for the market will be up.”
As of Oct. 31, 2013, GMO’s 7-year forecast is below:
| Stocks | |||
| US Large | -1.3% | Intl Large | 1.4% |
| US Small | -4.2% | Intl Small | 1.0% |
| US High Quality | 2.7% | Emerging | 3.2% |
| Bonds | |||
| US Bonds | 0.1% | Inflation Linked Bonds | 0.3% |
| Intl Bonds Hedged | -2.2% | Cash | -0.4% |
| Emerging Debt | 2.3% | ||
| Other | |||
| Timber | 5.9% |
Source:
https://www.gmo.com/America/CMSAttachmentDownload.aspx?target=JUBRxi51IICANcPenAXxYNaG5zSjYT78FgY%2fS2%2bHjHUU8Ll53xvryAM2c8B5Y8DXs9qeifx44r3MYbjhGGWvmYUD4VhpZBu6Xc3qBBAbdBk%3d
GMO's expected U.S. large cap real return is -1.3%. This number does not agree with what we find out with the market/GDP ratio and Shiller P/E ratio. The U.S. high quality’s return is expected to be 2.7% a year.
Insider Trends
As indicated by the three different approaches discussed above, the best buying opportunities over the last five years appeared when the projected returns were at their highest level from October 2008 to April 2009, when investors could expect 10% a year from the U.S. market.
If average investors missed this opportunity, corporate insiders such as CEOs, CFOs and directors did not. As a whole they purchased their own company shares at more than double the normal rate from October 2008 to April 2009. Many of these purchases resulted in multi-bagger gains. This confirmed again the conclusions of earlier studies: The aggregated activities of insiders can serve as a good indicator for locating the market bottoms. Insiders as a whole are smart investors of their own companies. They tend to sell more when the market is high, and buy more when the market is low.
This is the current insider trend for S&P 500 companies:
The latest trends of insider buying are updated daily at GuruFocus' Insider Trend page. Data is updated hourly on this page. The insider trends of different sectors are also displayed in this page. The latest insider buying peak is at this page: September of 2011, when the market was at recent lows.
Conclusion: The stock market is not cheap as measured by long term valuation ratios. It is positioned for about 0 to 2.2% of annual returns for the next decade. By watching the overall market valuations and the insider buying trends investors will have a better understanding of the risk and the opportunities. The best time to buy is when the market valuation is low, and insiders are enthusiastic about their own company's stocks.
Investment Strategies at Different Market Levels
The Shiller P/E and the ratio of total market cap over GDP can serve as good guidance for investors in deciding their investment strategies at different market valuations. Historical market returns prove that when the market is fair or overvalued, it pays to be defensive. Companies with a high quality business and strong balance sheet will provide better returns in this environment. When the market is cheap, beaten down companies with strong balance sheets can provide outsized returns.
To summarize:
1. When the market is fair valued or overvalued, buy high-quality companies such as those in the Buffett-Munger Screener.
2. When the market is undervalued, buy low-risk beaten-down companies like those in the Ben Graham Net-Net Screener. Buy a basket of them and be diversified.
3. If market is way over valued, stay in cash. You may consider hedging or short.
If you are not a Premium Member, we invite you for a 7-day Free Trial.
Also check out: