Users can access a few premade templates for the Excel Add-in and Google Sheets add-on, including the DCF Calculator Template that allows users to compute a stock’s intrinsic value based on a two-stage discount cash flow model.
Excel Add-in Access
To access the Excel Add-in templates, please first install the Excel Add-in using the steps outlined in the Getting Started guide. You can then download the templates by clicking on the “Explore Templates” button on the Excel Add-in page.

The following image illustrates a sample DCF Calculator template for Visa Inc. (V).

Enter the stock symbol in Cell B18, the first year of the discounted cash flow model calculation in Cell B19 and the base year value in Cell B20.
The template allows you to enter the growth-stage growth rate in Cell B21, the terminal-stage growth rate in Cell B22 and the discount rate in Cell B23. Enter a 1 in Cell B24 to add tangible book value to DCF fair value, or a 0 to exclude tangible book.
You will see the fair value in Cell B41. Cell B43 gives you the margin of safety for the stock given the stock’s current share price.
Google Sheets Access
To access the templates, please first install the Google Sheets add-on and download the templates using the steps outlined in the Quick Start Guide.
Usage
Enter the stock ticker symbol in Cell B18.

First year and first-year value
Enter the first year of the DCF Calculation in Cell B19 and the first-year value in Cell B20.

For the first-year value cell, either enter the appropriate value listed in the per-share data table or your own value.

Growth rates
Enter the growth-stage growth rate in Cell B21 and the terminal-stage growth rate in Cell B22.

The growth-stage rate represents the growth rate during the 10 years of “fast growth.” The adjusted growth rate caps the reported growth rates between 5% and 20%.

Likewise, the terminal growth rate represents the growth rate during the 10 years of “slow, terminal” growth. The default value for the terminal growth rate is 4%.
Discount rate
Enter the discount rate in Cell B23.

Add Tangible Book Value
Enter a 0 or 1 in Cell B24 depending on if you want to add tangible book value to your fair value calculation.

The following screen shot illustrates a sample fair value calculation for Walmart Inc. (WMT).
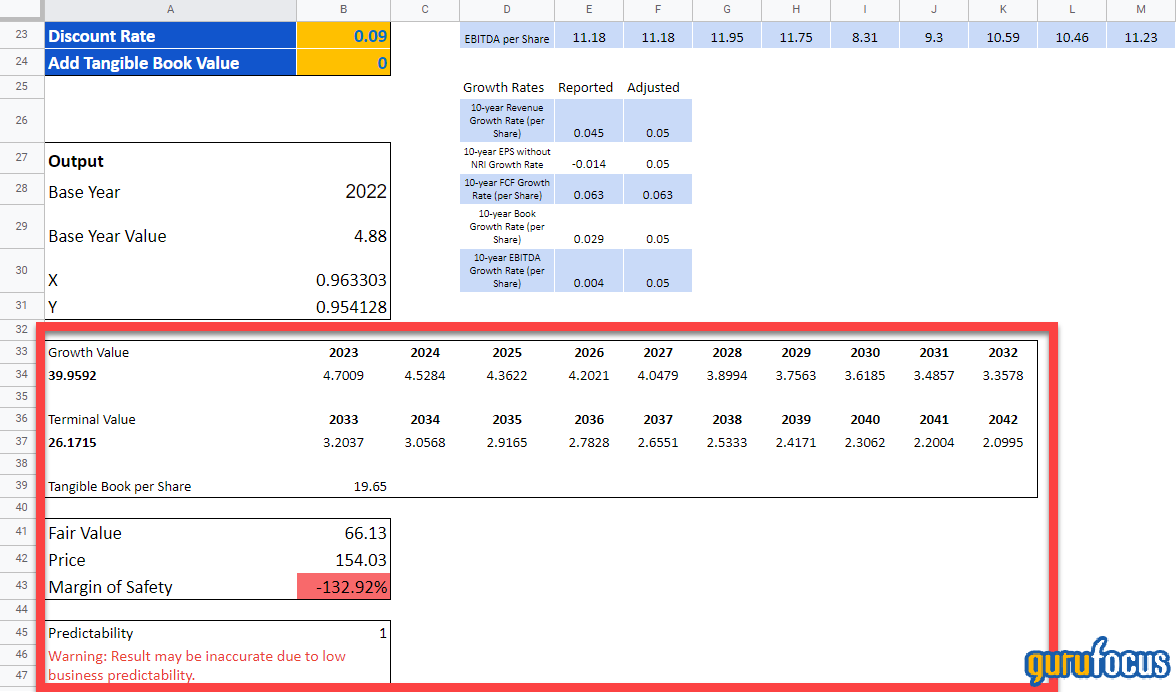
Cell B41 reports the fair value of the stock based on the input parameters, while Cell B43 reports the margin of safety. Further, if a stock’s business predictability is 1, the template warns the result may be inaccurate due to low business predictability.
If you have any questions about our Google Sheets feature, please contact us. Users can also book a demo of the Google Sheets feature by clicking on the “Book a Demo” button.

Users can also try other premade templates, including the stock summary template and the historical financial charts templates.